Following the passage of the increase to the minimum wage for specified fast food workers, much attention has been paid to the impacts the wage increase will have on jobs. While anecdotal data, including the closure of legacy fast-food chain stores in California, has made headlines, we are now able to use empirical data to track the law’s impacts on jobs and the economy. Despite what some are saying, the data are clear: newly passed fast food minimum wage laws are leading to job losses in California.
Why are some reporting job growth in the sector? Those attempting to argue there has been no impact (or even a positive impact) on jobs and the economy have been highlighting data that are not seasonally adjusted. Calculating the change over the year, as is correctly done in those reports, accounts for seasonal factors. However, a full consideration of the data as shown in the chart below raises several points:
- The alleged growth consists of one month of data, and one data point does not represent a trend. More importantly, the July data point those reports rely on is preliminary. It will change in the updated data that will be released next month.
- Even using this data, there has been a marked slowing in Limited Service Restaurant (the industry group containing the affected fast food businesses) hiring in California. In the first quarter last year, this industry’s hiring in California tracked the US growth rates. In the first quarter of this year as businesses began preparing for the higher labor costs, the rate of hiring in California plunged and then vanished in May
Seasonal adjusted data is the more appropriate series to assess a trend. Seasonally adjusted data corrects for seasonal fluctuations in industries such as Limited Service Restaurants that vary substantially over the year. It is also the form of data consistently used by the Governor (other than in this case), EDD, and the media in reporting both labor force and jobs data in their monthly releases, although the Center uses both the adjusted and unadjusted data in its analyses.
Using the seasonally adjusted series available through the St. Louis Federal Reserve Bank Economic Data (FRED), employment in the associated industry grouping, Limited-Service Restaurants and Other Eating Places, grew throughout most of 2023. However, the number of limited-service restaurant jobs fell each month since January through June 2024. The preliminary data in this series also shows an uptick in July, but overall jobs are 2,800 lower than their peak in January.
Current job levels are likely overestimated in this industry. Both the adjusted and unadjusted data comes from estimates relying on models and a monthly survey under the Current Employment Statistics (CES) program. These estimates are updated at the beginning of each year using the actual job counts from the Quarterly Census of Employment & Wages (QCEW), revising the March benchmark used as the base for the monthly estimates.
The QCEW data to date suggests the CES data used above may be overestimating the job numbers in this industry by up to 10,000, and the actual job losses may be correspondingly larger. To see this effect, the following table shows the difference between the CES monthly numbers (not seasonally adjusted) compared to the QCEW data (for the three industries making up the equivalent of the CES grouping) that is available to date.
As indicated in this comparison:
- There are no significant differences in the first three quarters, which is to be expected given that the current CES estimates use March 2023 as their beginning benchmark.
- The growing divergence in the 4th quarter, however, suggests that employers had already begun to adjust their labor costs in anticipation of the higher costs.
- The results in the table—as with the July CES number proponents are now using to insist higher wages have no effect on job levels—are preliminary. Additional information will be available in the 2024 first quarter job counts that will be released by September 4. This release will provide more definitive data on steps employers in this industry took leading up to the effective date of the new minimum wage in April.
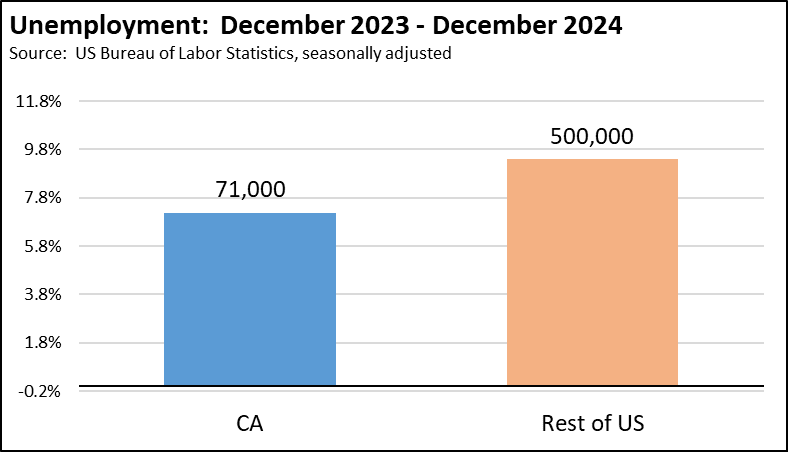
Impacts to minimum wage increase go beyond just lob loss. As restaurant jobs have stalled or declined, associated costs are being passed down to consumers, driving even higher the state’s cost-of-living crisis, especially compared to the rest of the nation. Using the same formula as used by Department of Finance to calculate the California CPI, prices for the Food Away from Home component grew 5.2% in California as of May
Hiring cutbacks have also hit youth (age 16-19) the worst as employers have turned more to workers already having the skills to match the higher wage, sharply reducing the opportunities for early acquisition of the workforce skills that lead to long term employment stability and higher income potential. Using the US Census Bureau, Current Population Survey microdata to analyze the age distribution of workers in July of each year, employment of youth workers dropped 40% between 2023 and 2024.
The economic reality is clear: while the intention behind higher minimum wages is to support workers, the law has led to job losses and increased costs for California families already struggling with the state’s high cost of living.