Summary
Both California and the federal government have relied heavily on publicly and privately funded subsidies to incentivize development of alternative energies and related energy efficient products. As the state is now considering potentially major expansions of these programs, it is appropriate to consider whether this approach as applied in the past has been broadly distributed, or instead has in practice favored specific income groups or regions.
Most prior studies have generally concluded that such subsidies—although funded by the broader taxpayer or consumer universe—have tended to show more benefits to higher income earners. The updated data analyzed in this report supports the same conclusion, but regional distribution of these benefits are addressed as well.
- Previous energy subsidies have tended to benefit higher wage earners. For the period 2007-2013, about half the solar panels installed in California were in the zip codes with the top 30% of median household income. The bottom 20% received only 7.8%.
- Looking at the broader range of energy products—solar panels, solar heating, heat pumps, and other energy efficiency products—promoted by the Federal Residential Energy Tax Credit, the 16.9% of Californians filing tax returns with AGI over $100,000 in 2012 claimed 69.7% of the total credit amount in our state.
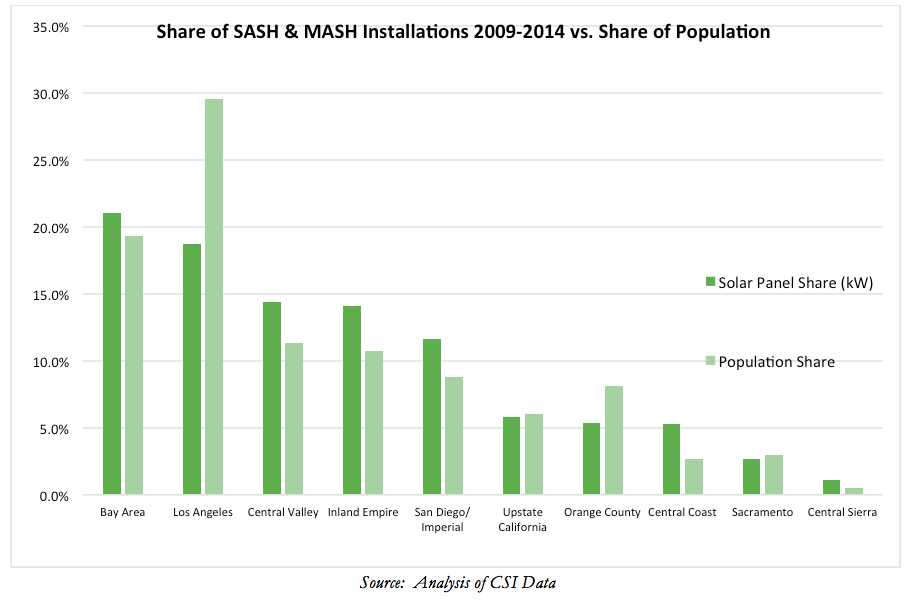
- The Bay Area has consistently benefited more from these programs than other regions of the state, both in absolute terms and relative to their population size. While comprising about 19% of the state’s population, the Bay Area was the location of 23% of all solar panel installations (by capacity) 2007-2013, 21% of the low-income solar panel programs 2009-2014, and 24% of the Federal Residential Energy Tax Credit in 2012.
- In sharp contrast, Los Angeles region has been underrepresented in these programs, containing over 29% of the population but having only 19% of solar panel installations 2007-2013, 19% of the low-income solar panel programs 2009-2014, and 20% of the Federal Residential Energy Tax Credit in 2012.
- Benefits vary widely across other geographic levels as well. On a county level, solar panel installations 2007-2013 ranged from 77.3 kW/1,000 population in El Dorado County to zero in Alpine County. Senate Districts ranged from an estimated 57.0 kW/1,000 population in SD01 (Gaines-R) to only to only 4.6 kW/1,000 population in SD35 (Hall-D), a spread of over 1200%. The spread for Assembly Districts is even wider, ranging from 68.8 kW/1,000 population for AD06 (Gaines-R) to 1.6 kW/1,000 population for AD59 (Jones-Sawyer-D).
- The low income assistance program under the Single-Families Affordable Homes (SASH) and Multifamily Affordable Solar Housing (MASH) rebates have been successful in targeting lower income areas. The lowest 30% household median income zip codes received just over half (54.3%) of the solar panel projects, measured by capacity. However, the overall impact on the state’s energy picture is not all that significant. The program files show a total of 40 MW installed under these two components 2009-2014. The broader data files used in this report show a total of 1,025 MW installed in the state from 2007-2013.
Introduction
The state’s AB 32 Climate Change Program and its component parts such as the Renewable Portfolio Standard (RPS) have relied heavily on the use of private and public subsidies to promote the introduction of non-fossil fuel energy technologies, including alternative energy for electricity production, electric vehicles, and related products. In the case of solar panels, many of the state’s existing programs are nearly fully subscribed, and the currently dominant example is represented by the 30% federal investment credit for residential solar systems. This federal tax credit is slated to expire after December 31, 2016.
Associated with this approach is the eternal public policy question of who pays and who benefits from these subsidies. Public subsidies such as grants, tax credits, and subsidized loans get paid by the general public through general tax or fee revenues, and through resulting shifts from other public spending priorities such as schools, health and welfare programs, and public safety. Private subsidies such as the preferential rates required under the RPS for qualifying technologies get paid through the broader rate-paying base through higher monthly bills. Additional cost shifting occurs as consumers face higher prices on goods sold or produced in the state.
A number of previous studies have looked at this issue from the viewpoint of tax equity, whether these types of alternative energy incentives used at both the state and federal level are a form of regressive taxation. That is, whether the incidence of cost falls more heavily on lower income segments of the population, while the benefits accrue more to the higher income segments better able to afford the still-high entry costs to purchase solar panels, electric vehicles, fuel cell systems, and other green energy goods.
A 2014 report by the State Auditor1 indicated that the California Solar Initiative (CSI) created by SB 1 (Murray, Chapter 132, Statutes of 2006) was likely to be successful in its goal of promoting additional solar power production in the state. The report, however, also concluded in part that the program benefits were accruing more to higher income areas:
. . . a lack of comprehensive demographic data prevents us from concluding whether the solar initiative and the decal program have served a diverse population of Californians. However, the limited demographic data that does exist shows that participants in the solar initiative’s General Market Program tend to be largely older, wealthier, and have received more education than most California homeowners. Given the high up‑front costs of installing solar energy systems, it is not surprising that the demographic group participating in the solar initiative would fit this profile. Financing such an investment, even after taking advantage of the solar initiative incentive and federal tax credit, is probably difficult for those with lower‑than‑average incomes. (State Auditor, p. 3)
While demographic data is not collected as part of the CSI applications, a series of evaluation reports2 conducted under contract for the California Public Utilities Commission addressed this issue through a survey of persons participating in the program. From the survey results, persons obtaining solar panels through CSI were more likely than the general population to be older, more educated, earn higher incomes, and live in 2-person households:
Most CSI participants are at least 55 years old, have a college education, and live in two-person households with annual incomes of $100,000 or more. The CSI participants tend to be slightly older and more affluent than the population of California homeowners as a whole. Less than one-third (29 percent) of CSI participants are below the age of 55; for context, U.S. Census data indicates that 48 percent of California homeowners are below the age of 55. Similarly, the median household income of California homeowners is $79,138, while 60 percent of CSI participants have an income of at least $100,000. The high percentage of participants who live in two-person households indicates that many solar PV adopters are “empty nesters” (parents of grown children) or “DINKs” (dual income, no kids). (Navigant, p. 57)
Similarly survey data of this type was used to develop detailed profiles of electric vehicle buyers, which can be accessed through an interactive tool to provide profiles by region and selected demographics.3
In contrast, a 2013 study by Center for American Progress4 concluded that solar panels were beginning to penetrate more middle class neighborhoods:
The question is: Who is buying up all of those solar power systems? Through our analysis of solar installation data from Arizona, California, and New Jersey, we found that these installations are overwhelmingly occurring in middle-class neighborhoods that have median incomes ranging from $40,000 to $90,000. The areas that experienced the most growth from 2011 to 2012 had median incomes ranging from $40,000 to $50,000 in both Arizona and California and $30,000 to $40,000 in New Jersey. Additionally, the distribution of solar installations in these states aligns closely with the population distribution across income levels.
However for California, the study also noted it relied on data covering only 55% of solar installations in the state (the CSI working data set discussed below), while data for Arizona and New Jersey were more comprehensive.
Finally, a more recent study by the Energy Institute at Haas5 took a broader look through federal income tax data of a wide range of energy related tax credits, including solar panels, electric vehicles, and energy efficiency retrofits. The study concluded that the top 20% of income earners received 60% of the credits, while the bottom 60% received only 10%:
Since 2006, U.S. households have received more than $18 billion in federal income tax credits for weatherizing their homes, installing solar panels, buying hybrid and electric vehicles, and other “clean energy” investments. . . We find that these tax expenditures have gone predominantly to higher-income Americans. The bottom three income quintiles have received about 10% of all credits, while the top quintile has received about 60%. The most extreme is the program aimed at electric vehicles, where we find that the top income quintile has received about 90% of all credits.
Using some of same but updated data sources as used in these previous studies, the following analysis looks at the distribution of subsidies represented by these programs in California, in order to provide insight into which areas are likely net providers of the subsidies and which are likely net beneficiaries.
Distribution of Solar Panels
This analysis looks at the geographic distribution of panels installed in California during the period 2007-2013. Data is taken from the Department of Energy’s National Renewable Energy Laboratory (NREL) files containing the number of projects and size of project (kW) by zip code, including projects funded through CSI, publicly owned utilities, and other federal sources. Additional background is discussed in the Data Sources section below.
Statewide Distribution of Solar Panels by Income Level
The NREL data was matched with median household income drawn from the American Community Survey. The zip codes were then ranked by income, and aggregated into rough income deciles. The results are shown in the following table, showing the relative shares both by the number of projects and the total installed capacity.
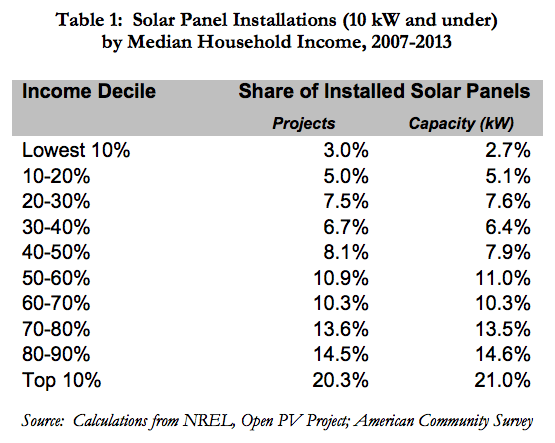
As indicated, half (49.1% by capacity) of the panels installed during this seven-year period were in zip codes with the top 30% of median household income. The bottom 20% received only 7.8%. Projects in the lower income areas were also typically smaller (i.e., their share measured by capacity is lower than their share measured by number of projects), with the turning point in the upper middle incomes able to afford the larger systems.
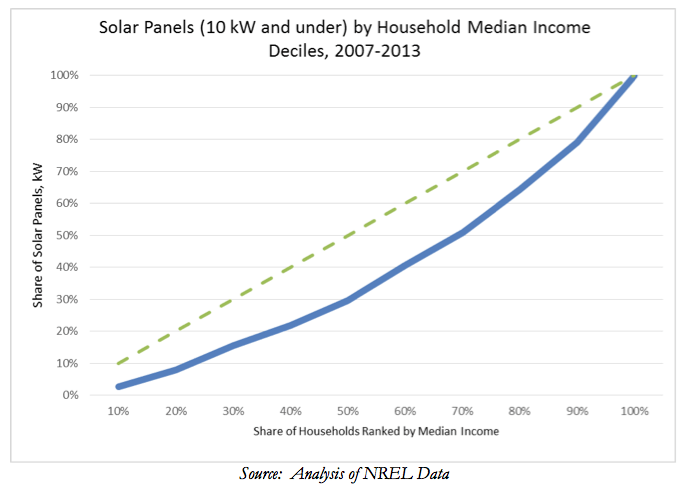
This data is illustrated in the following figure. The dotted green line represents an equal distribution across all income areas, while the blue line shows the actual cumulative share by capacity. Lying below the theoretical equal distribution line, the actual incidence of solar panel installations has been skewed towards higher income areas.
Solar Panel Distribution by Region
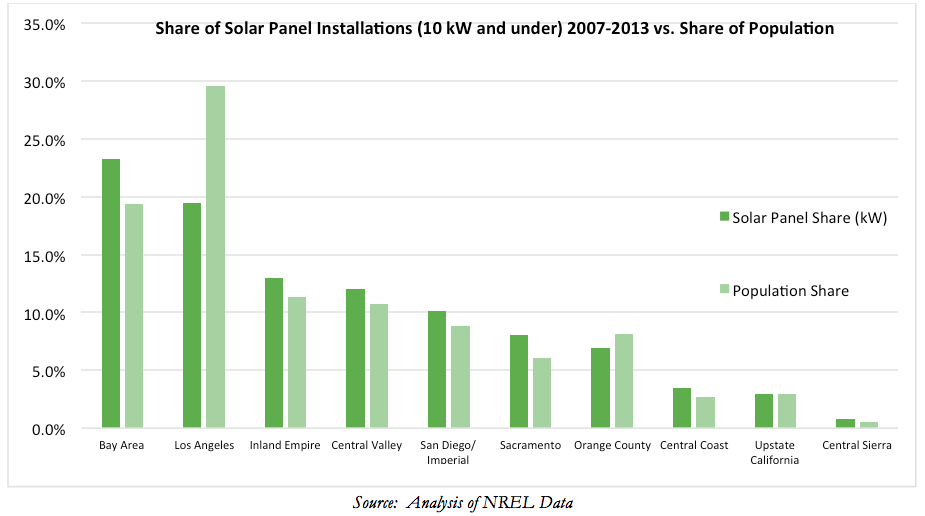
The following chart compares the relative share of solar panels (10 kW and under) installed during 2007-2013 to the relative share of population in each region. Bay Area has the highest share of panels (23.3%) and along with Inland Empire, Central Valley, San Diego/Imperial, Sacramento, Central Coast, and Central Sierra shows a higher benefit gain relative to their population size. These regions gained at the expense of Los Angeles and Orange County regions, but especially so in the case of Los Angeles with showed only 19.5% of total installations compared to 29.5% of the population.
Solar Panel Distribution by County
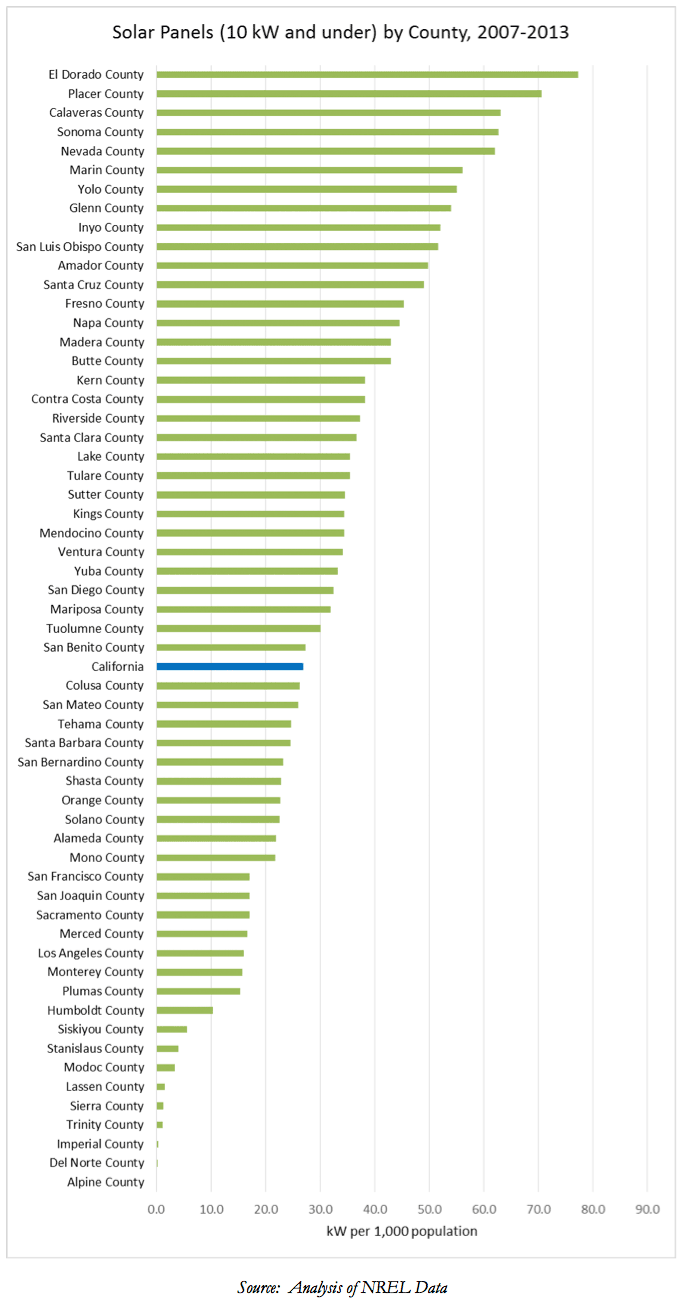
To provide a common basis of comparison, the following chart shows solar installations on a consistent unit of kW per 1,000 population for the period 2007-2013. As shown, there is wide variation in which counties have benefited from these programs, ranging from 77.3 kW/1,000 population in El Dorado County to zero in Alpine County.
While the graph below shows rankings based on capacity, rankings based on number of projects is generally the same or similar for all counties except San Francisco. Their rank shown in the graph is 43rd by capacity, but jumps to 29th based on number of projects. This change reflects the relatively smaller housing units in San Francisco combined with projects sized more with the lower availability of sunny days.
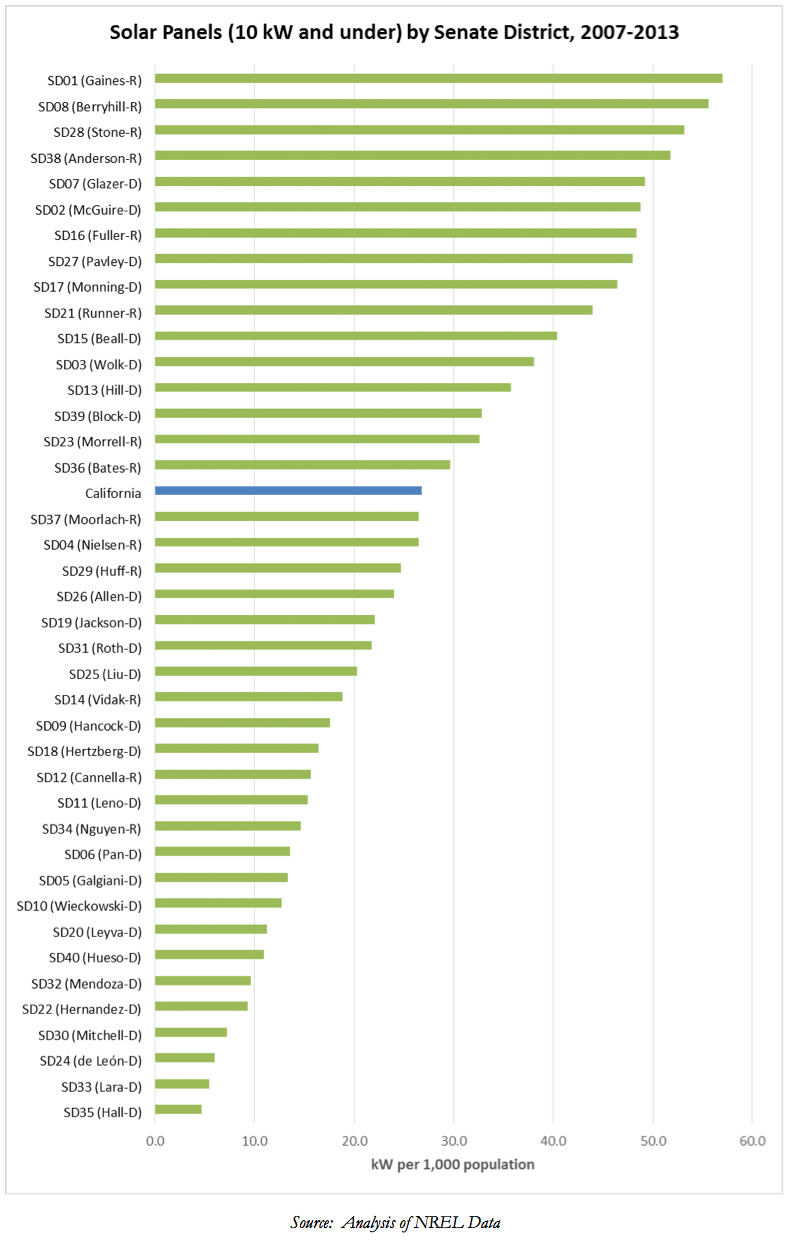
Solar Panel Distribution by Legislative District
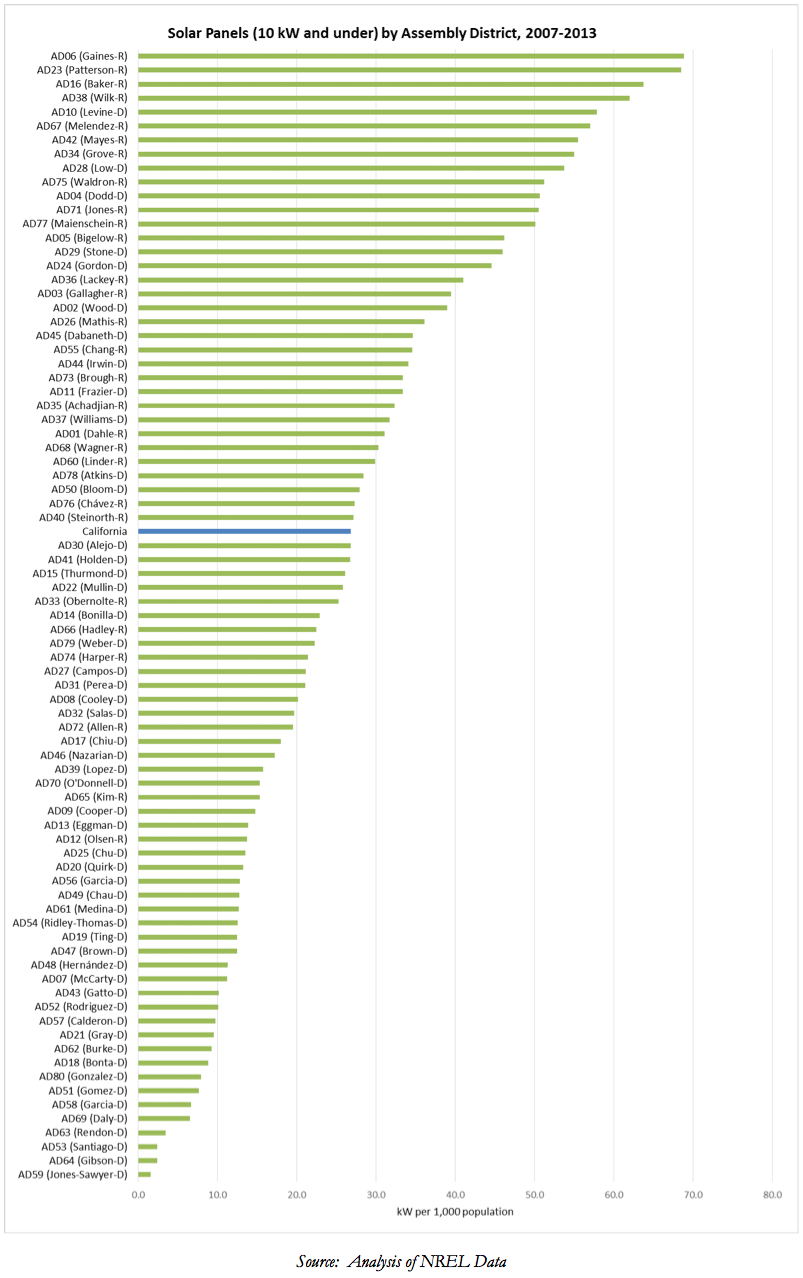
Charts following the counties show the same distribution for Senate Districts and Assembly Districts, again based on capacity per 1,000 population.
As with counties, installations have varied widely by District. Senate Districts range from 57.0 kW/1,000 population in SD01 (Gaines-R) to only to only 4.6 kW/1,000 population in SD35 (Hall-D), a spread of over 1200%. The spread for Assembly Districts is even wider, ranging from 68.8 kW/1,000 population for AD06 (Gaines-R) to 1.6 kW/1,000 population for AD59 (Jones-Sawyer-D).
SASH & MASH
As discussed under the Data Sources section, the CSI program was created with two low income components specifically to deal with the tendency of solar panel installations to gravitate to higher income areas due to their high costs even when accounting for the various state and federal subsidies. Data by zip code is also available for these two programs—the Single-Families Affordable Homes (SASH) and Multifamily Affordable Solar Housing (MASH) rebates. Because MASH covers multiple units within a single project, the analysis below uses data only by capacity rather than also looking at installation totals as above. Data in the CSI database provides information starting with implementation of these components in 2009. To provide adequate data, the 2014 installations are included in the totals as well.
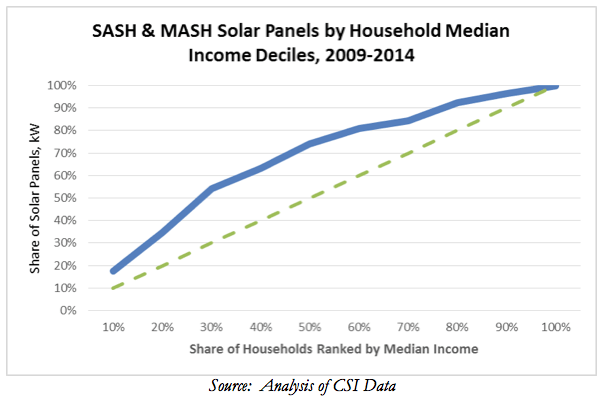
Considered by income distribution, these two components appear to have succeeded in fulfilling their target goals. Table 2 shows the capacity distribution using the median household income deciles established above. Considering the cumulative curve shown in the following chart compared to the equitable distribution (green dashed) line, a relatively greater share of these projects have been located in lower income zip codes. The lowest 30% household median income areas received just over half (54.3%) of the projects measured by capacity.
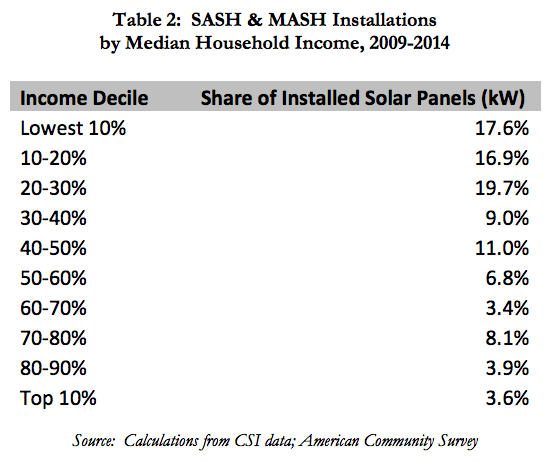
However, even though the program is meeting its targets on a relative basis, the overall scope remains relatively limited. For 2009-2014, the CSI files show a total of 40 MW under these two components. The NREL files used above show a total of 1,025 MW installed from 2007-2013.
Geographically, these two components show a distribution similar to the much larger universe for all panel installations. The Bay Area still leads in total share, but its dominance relative to population is smaller in this case compared to other regions such as Central Valley, Central Coast, and Inland Empire. Both the Los Angeles and Orange County regions, however, are well below their population levels, Los Angeles again dramatically so.
Federal Residential Energy Tax Credit
This federal tax credit covers a range of energy efficiency and alternative energy improvements, including the current 30% tax credit for qualified solar electric, solar water heating, small wind, fuel cells, and geothermal heat pumps and various individual limits applicable to a range of energy efficiency retrofits. The credits are nonrefundable and therefore claimed only by persons with a positive tax liability. In this respect, they do not necessarily represent all such purchases within a given year. On the other hand, these subsidies are often critical to making these purchases economic, and therefore they likely cover a broad portion of the universe. In any event, they are currently the primary source of subsidy for many of these purchases, and as such provide useful insights into who and what regions benefit from them.
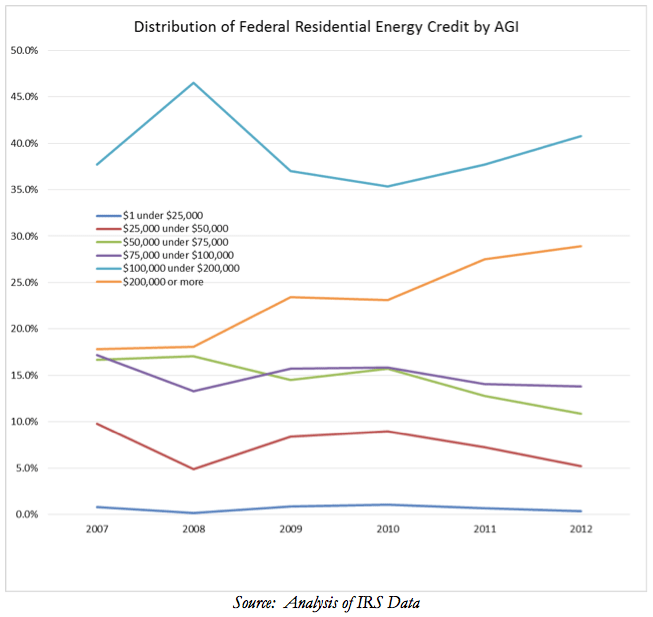
Based on federal income tax data, this credit is increasingly being used by persons earning over $100,000 AGI. In Tax Year 2007, 14.6% of Californians filed tax returns with AGI over $100,000 claiming 43.5% of the total credit. In 2012, the number of returns for this class increased to 16.9%, and the amount of the credit claimed increased far more to 69.7%.
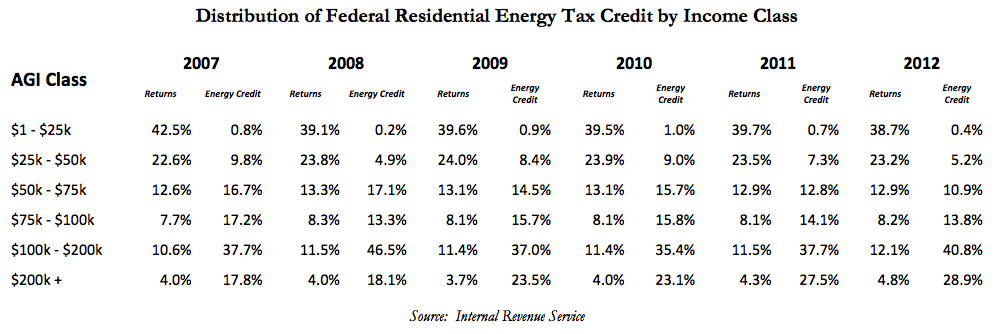
As shown in the chart below, the relative share claimed by the two highest AGI classes has been increasing, while the middle and lower income classes have been declining. Note that 2008 is fundamentally an outlier. The total California-claimed credit that year was only $14.3 million, vs. $79.6 million in 2007 and $456.3 million in 2009.
Considered by geography, the tax credit data shows a distribution for the broader range of energy subsidies similar to that shown earlier for solar panels alone. Even accounting for the outlier data in 2008, the Bay Area continues to be the largest user of these subsidies, remaining well ahead of Los Angeles region even though the Bay Area is 2/3 the size of Los Angeles. While the Los Angeles share has declined, some of the other regions—San Diego/Imperial, Inland Empire, Central Valley—have picked up some of the share not taken over by the Bay Area.
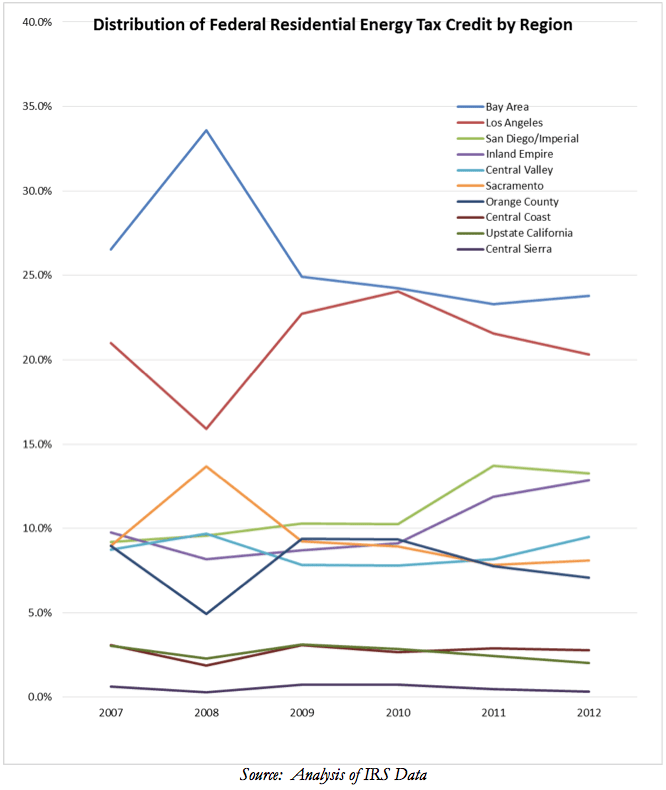
While only the regional and state level results are provided here, additional estimates are possible for the county and legislative district level applying the approach used earlier in this report.
Data Sources
Solar Panel Installations
There are several sources providing location data on solar panels installed within California. These differ widely in their coverage and years for which data is available. The three data bases considered for this report are:
- As indicated above, CSI was created by SB 1 (Murray, Chapter 132, Statutes of 2006) and provided $3.4 billion in subsidies to achieve three primary goals within 13 years: (1) install 3000 MW solar generation capacity, (2) establish a self-sufficient solar industry, and (3) place PV systems on 50% of new homes. The State Auditor’s report cited above indicated that the first goal was near being met. However, as indicated by the solar industry’s continued reliance on the current federal tax credit,6 goal 2 likely remains unfulfilled.
CSI is composed of five programs: (1) General Market program providing rebates for customers in PG&E, SCE, and SDG&E territories for solar photovoltaics (PV) and of solar thermal systems for homes, commercial, agricultural, government, and non-profit buildings; (2) Thermal Program for solar hot water rebates for homes and businesses within the same 3 utilities; (3) Single-Family Affordable Homes (SASH) rebates for low-income residents owning their own home; (4) Multifamily Affordable Solar Housing (MASH) rebates for multi-unit affordable housing; and (5) RD&D Program to fund research, development, demonstration, and deployment.
CSI provides a working data set7 of applications filed and completed for the programs, screened of critical data errors from the raw data set. Data for the General Market projects is available through the beginning of the program in 2007 to current. Data is limited to facilities within the service areas of the three utilities—PG&E, SCE, SD&E—covered by the program.
- Currently Interconnected Data Set8 contains data on all interconnected solar PV systems within the PG&E, SCE, and SD&E service areas, including systems covered through CSI, earlier California subsidy programs, and other sources. Data covers more years—1996 through current—but is still limited to the three utilities. This data set contains some duplicates as a new application for interconnection must be filed to the utility when a project is modified. No corrections have been made in the data base for this factor.
- Open PV Project9 maintained by the Department of Energy, National Renewable Energy Laboratory (NREL) is a voluntary data base covering federal sources, state sources such as those listed above, as well as publicly owned utilities and private vendors. The listings are far more comprehensive but rely on voluntary updates from these sources following the initial seeding of the data. Coverage is for all areas of California from 1994 to current (with some earlier year entries). However, the data appears to be fully current only through 2013. The data is scrubbed for apparent duplicates.
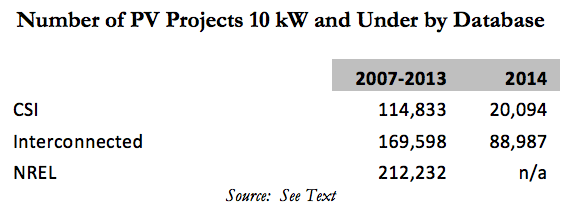
Comparing the data coverage, the following table shows the number of completed projects under 10 kW for each of the three sources. The year 2007 was selected based on the starting date of the CSI program; 2013 as the final full year of data under the Open PV files. The 10 kW is the cut-off capacity for the residential and small commercial component of the General Market program under CSI.
While the Interconnected Data Set shows an upsurge in installations in 2014 as solar companies began marketing the imminent demise of the federal tax credit, the NREL set was chosen due to its broader geographic and programmatic coverage.
All data is available by zip code. Totals for each were used to estimate data by region, county, and legislative district using geographic equivalence files, as discussed in more detail in the Methodology section of the Center for Jobs and Economy.10
Federal Residential Energy Tax Credit
Detailed tax data is available from the IRS at zip code level through their SOI Tax Stats.11 Data is broken down by the AGI categories used in this report for various entries from the 1040 forms. Unlike the comparable data used in the Haas report cited in the Introduction, the state-level data does not provide breakdowns of the allocations to the individual components of this credit. Instead, only a single entry of the total credit claimed is provided for each AGI level.
Income
All income data is taken from the American Community Survey, 5-year survey data. For zip codes, median household income data is taken from the Zip Code Tabulation Area (ZCTA) data, similar to the approach used in the Center for American Progress report cited in the Introduction. As indicated by the Census Bureau, ZCTAs are generally consistent with zip code geographic areas, but are held stable throughout the reporting period to provide a consistent level of comparison. During the period covered, however, relatively few changes were made to the California zip codes due to the depressed level of new housing construction.
1. California State Auditor, California’s Alternative Energy and Efficiency Initiatives, Report 2014-124, February 2015.
2. Navigant, California Solar Initiative Market Transformation Study (Task 2), March 27, 2014.
3. Clean Vehicle Rebate Project, EV Consumer Survey Dashboard, http://cleanvehiclerebate.org/eng/survey-dashboard.
4. Center for American Progress, Solar Power to the People: The Rise of Rooftop Solar Among the Middle Class, October 21, 2013.
5. Energy Institute at Haas, University of California, Berkeley, The Distributional Effects of US Clean Energy Tax Credits, July 2015.
6. The Solar Foundation, California Solar Jobs Census 2014, February 2015, reported (p. 10) that 43% of solar employers in California expect to lay off staff and contractors in 2017 after the federal tax credit expires, while 49% of solar employers nationwide expect to do so.
7. Solar California, Data Downloads, https://www.californiasolarstatistics.ca.gov/data_downloads/.
8. Solar California, Data Downloads, https://www.californiasolarstatistics.ca.gov/data_downloads/.
9. National Renewable Energy Laboratory, The Open PV Project, https://openpv.nrel.gov/.
10. Center for Jobs and Economy, Methodology and Sources, https://centerforjobs.org/methodology-and-sources/.
11. IRS, SOI Tax Stats—Individual Income Tax Statistics—ZIP Code Data (SOI), http://www.irs.gov/uac/SOI-Tax-Stats-Individual-Income-Tax-Statistics-ZIP-Code-Data-(SOI).