The Center for Jobs and the Economy has released a special report that delves into the tax burden on personal income in California, particularly focusing on its impact on different family types. For additional information and data about the California economy visit www.centerforjobs.org/ca.
Tax Bite on Personal Income
While California per capita incomes remain high, the tax bite on those incomes remains elevated as well. Debates on just how much often do not go much beyond the “yuh-huh/nuh-uh” level. In this post, we attempt to shine a bit of data on it.
The actual impact will vary widely by individual circumstances: size and type of family, age of taxpayers, age of children if any, whether rent or own and for how long and where, consumption practices, income amount and sources, and a large number of other factors. To simplify the data, this analysis narrows in on taxes paid relative to wages, both income and payroll. Four family types are modeled: married with and without 2 young children and single with and without 2 young children. All four are assumed to be renters with only wage and salary income, which in turn is assumed to be divided equally among the adult(s).
The after-tax income effects are modeled through National Bureau of Economic Research’s TAXSIM program. This application models both federal and all state income tax systems, and consequently considers not only tax rates but as well credits and deductions such as the EITC, child credits, and renters credits. The payroll tax component addresses only FICA. Consequently, California’s SDI tax is added in manually. TAXSIM was run for all four family types based on 2022 tax laws, starting at the current federal poverty level and increasing by $5,000 income increments.
The overall results for California are shown in the following chart. To put these into context, the shaded area represents the band covered by the 2023 low income thresholds for the 12 largest counties in the state, as recently released by the Department of Housing & Community Development.
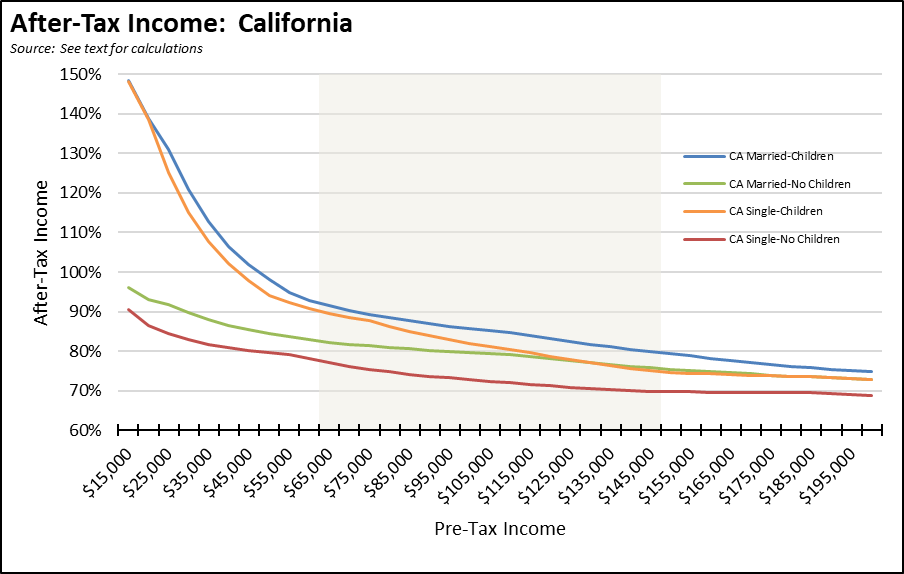
As indicated, it is possible for some families, in particular lower income with children, to have after-tax incomes higher than their earned income due to the interplay of the various tax credits and deductions. However, even those still officially classified as low income—those with pre-tax incomes at or below the shaded area depending on county—still see a substantial portion of their incomes shifted to tax payments rather than being available for housing and other daily needs. At the high end of the low income designation, as much as 20% (married-children) to 30% (single-no children) goes to the modeled taxes. More obviously also goes to the taxes not included in this example, including sales and use taxes, fuel taxes, property taxes and charges, utility taxes, taxes charged on businesses and paid indirectly by renters and consumers, and an astounding range of state, local, and federal fees.
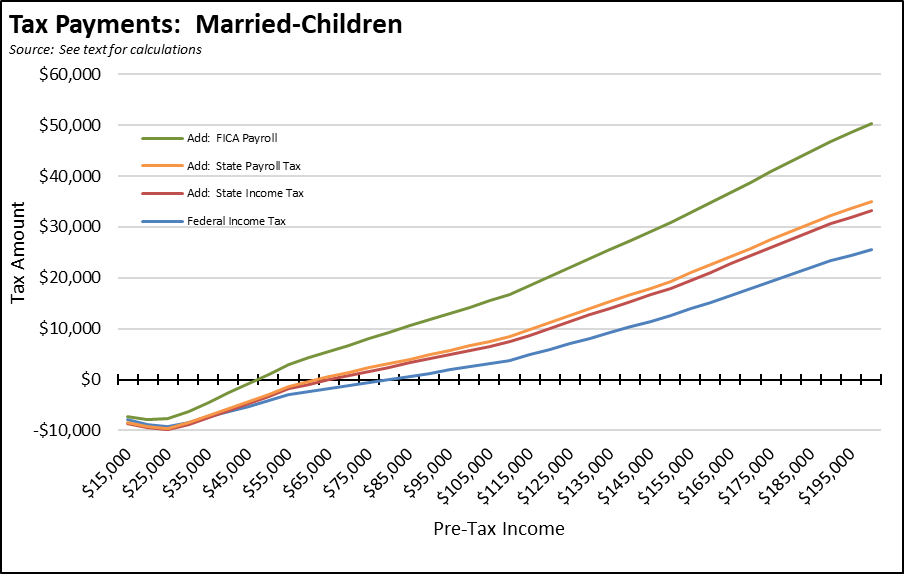
The primary tax bite comes from federal income tax and FICA payroll taxes, but California adds to the burden as well. While the effect again varies by family type, the following chart illustrates how the individual taxes interplay for the married-children modeled family, with each line adding on to the one below it.
In this example, the state income tax goes from refund to payment much quicker than the federal component. Beginning at about $35,000 earned income, a portion of refunds coming from federal EITC and child credits in fact gets diverted to pay the state tax instead of covering cost of living essentials as they are intended to. At about $80,000 earned income, the federal income tax finally shifts into a payment of $81, at which point state income taxes are taking in $2,352. Only at somewhere around $107,000 earned income do the federal tax payments catch up to what is owed to the state. Payroll taxes, however, add to the total burden through the modeled income range.
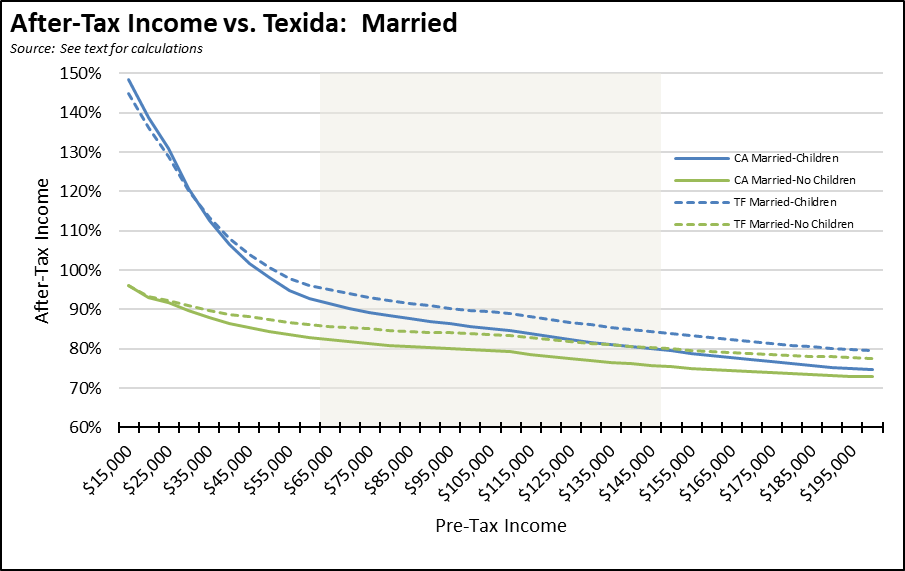
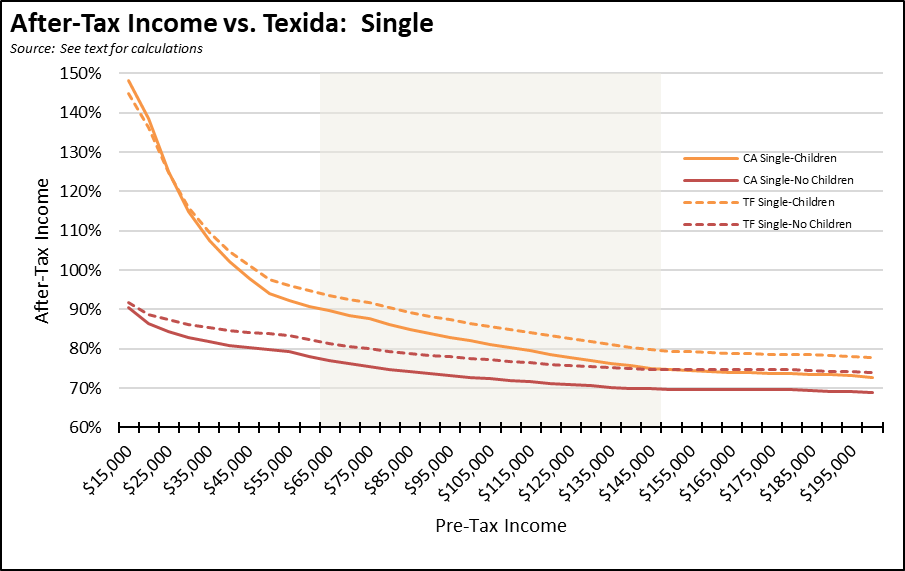
The effect of California taxes can also be seen by running the model for the same family types in a state with no income tax, which for purposes of this exercise shall be called “Texida (TF)” since the outcomes do not vary for these two states. For each family type, the resulting charts illustrate the effect on after-tax family incomes, expressed as a percent of pre-tax income. In all cases, shifting location improves family after-tax resources by up to about 5% of earned income.
The biggest tax effects, obviously, are on incomes above those modeled in this exercise. As incomes grow, the state taxes saved quickly cover the cost of a mortgage in a lower tax state, moving from renter to owner. At the maximum rates, the difference grows into a substantial savings. Both contribute to the growing number of high-earner taxpayers (those with an AGI of $200,000 or above) moving to other states.
But this exercise also illustrates how California’s high taxes affect lower incomes as well. Tax rates are steeply graduated. They apply early in the earnings scale, and the maximum permanent rates kick in at much lower income levels compared to other states that reserve their highest rates for the truly rich. Especially for those falling below the low-income designations, a 5% shift in the amount of income available for housing and other costs of living can be significant.