In promoting its policies, California is advocating that we need next generation regulations to cover virtually every aspect of the economy and personal lifestyle in order to achieve our climate change goals.
Recent data from the US EPA shows otherwise; a different policy approach can work equally well.
The other states are doing as well, if not better than, California in reducing emissions, especially when considering that most states reopened their economies far earlier following the pandemic. California’s turn toward more command-and-control regulation is not the only means to the state’s climate change goals. Our current market-based mechanisms, in conjunction with other market-oriented policies and a shift away from inflexible command and control approaches, can be more effective and far less costly to California families and businesses.
Table of Contents
- Can High Regulation and Good Jobs Go Together? The Challenge for the Future
- California's Overlooked Emissions: A Regulatory Reality Check
- Is California the Leader on Climate Change Action? EPA Data Reveals the State is Equal with the Rest of the Nation
- California is the Leader on the Cost of Its Climate Actions
- “California has shown the world that climate action and economic growth can work hand in hand.” – California's Economic Growth Relies on Imports from Just a Few Countries
- California GHG Emissions Rise as Economy Slowly Reopened
- Summary: Reevaluating California’s High-Regulation, High-Cost Approach
Can High Regulation and Good Jobs Go Together? The Challenge for the Future
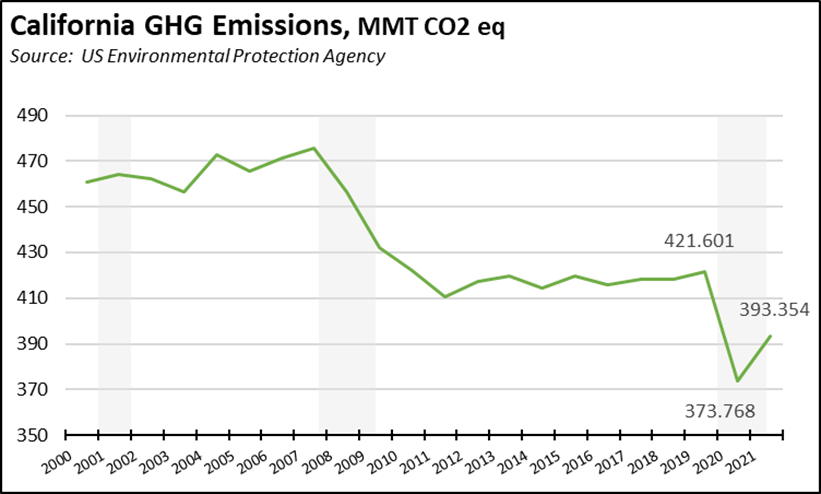
The chart above shows California’s greenhouse gas emissions (GHG) as reported in the recent state-level inventories up to 2021, from the US EPA. It is clear from the shaded regions that economic conditions have played a significant role in shaping the state’s emission trends. Notably, emissions experienced a slight dip after the Dot-com recession in 2001, followed by a substantial reduction during the Great Recession and California’s subsequent budget crisis, until 2011. GHG emissions experienced another significant decline with the onset of the state-ordered pandemic shutdowns, driven by business closures between 2020 and 2021. The state’s current regulatory push began in 2010 following the passage of AB 32. However, emissions grew 2.7% following the end of the major recessionary reductions in 2011, continuing until just before the pandemic in 2019. This indicates that emissions reductions are more closely linked to economic downturns than to the implementation of stringent and costly regulations.
California’s governor and Legislature have set clear priorities that require jobs and mounting regulations to find a way to coexist. However, the progress achieved to date in reaching the state’s climate goals can be attributed less to regulations, such as those laid out in the Air Board’s current Scoping Plan. Instead, emission reductions have been associated more with impacts from prior recessions and the pandemic. The Center’s September Employment Reports show that California’s employment recovery remains weak, ranking 7th worst among states compared to pre-pandemic levels in early 2020, and the state’s September unemployment rate increased to 4.7%, while the U.S. rate held steady at 3.8%, positioning California as the 3rd highest in unemployment, following only Nevada and DC.
The ability of the state to reach its GHG goals while still generating the jobs required to live here is, unequivocally, the long-term challenge for the future.
California's Overlooked Emissions: A Regulatory Reality Check
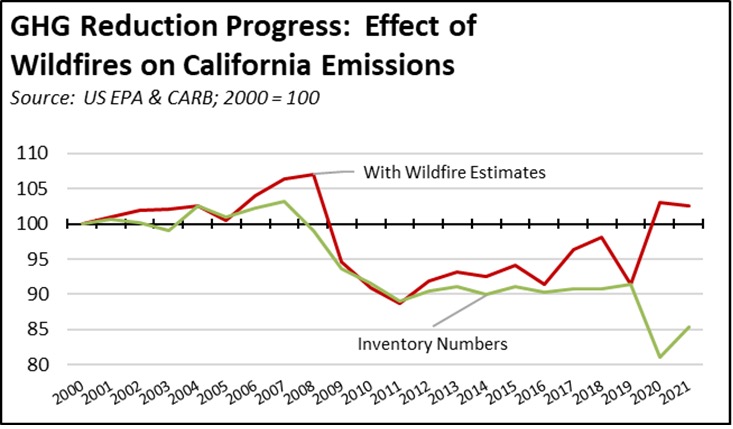
By neglecting the full spectrum of GHG emissions in California, the state’s regulatory focus, impacting every facet of the economy, has fueled a substantial increase in emissions in recent years. Various emissions inventories, including the data from the US EPA, solely account for emissions under potential regulatory control and omit the significant contribution from wildfires. Yet, decades of improper forest management stymied by lawsuits and low budget allocations, primarily on federal lands but, until recently, on state lands as well, have led to fuel buildup and declining forest health contributing to the severity of wildfires during drought periods. Incorporating the Air Board’s most recent wildfire emission estimates, wildfire emissions have in fact fully reversed whatever progress has been made under the state’s climate change program. Proper forest and wildlands management still remains a far more cost effective GHG strategy than those currently being pursued by the state agencies.
Is California the Leader on Climate Change Action? EPA Data Reveals the State is Equal with the Rest of the Nation
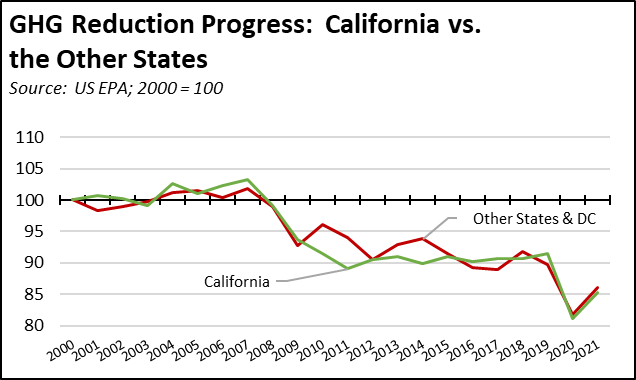
The following charts provide a comparison of California’s achievements with the combined results from the other states.1
In the first chart, emission levels are indexed to 2000 to show the longer-term outcomes over the period normally covered by the Air Board’s inventory data. As indicated, assessed over this period, California is equal with the other states in reducing GHG emissions.
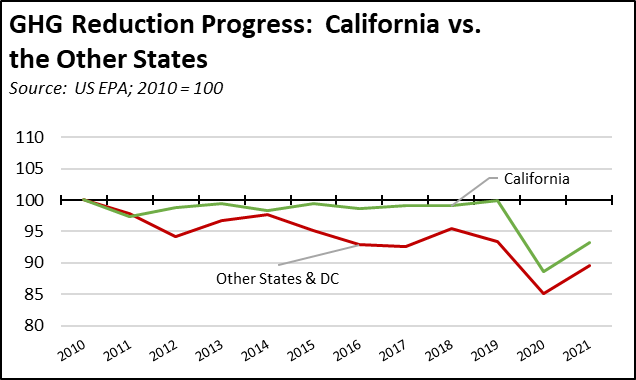
The second chart instead indexes the emission levels to 2010, the year California’s climate change program began with the AB 32 early action items, to compare progress during the period covered by the state’s current regulatory program. Looking at this period, California instead has done worse than the other states. California has been the leader in imposing an intensive and constantly expanding set of regulatory constraints, but the other states have produced actual emission reductions by pursuing alternative and generally less costly approaches. For example, the latest electricity generation data from US Energy Information Administration shows that in 2022, Texas, with its all-of-the-above approach to energy policy, encompassing gas, nuclear, renewable, and other sources, significantly outperformed California in terms of production capacity. Accordingly, Texas was able to generate 72% more electricity from non-CO2 sources compared to California, and wind and solar generation in Texas alone exceeded California’s by 157%. The amount of non-CO2 generation in Texas in fact was enough to replace about 90% of California’s total generation from all sources in this period.
California is the Leader on the Cost of Its Climate Actions
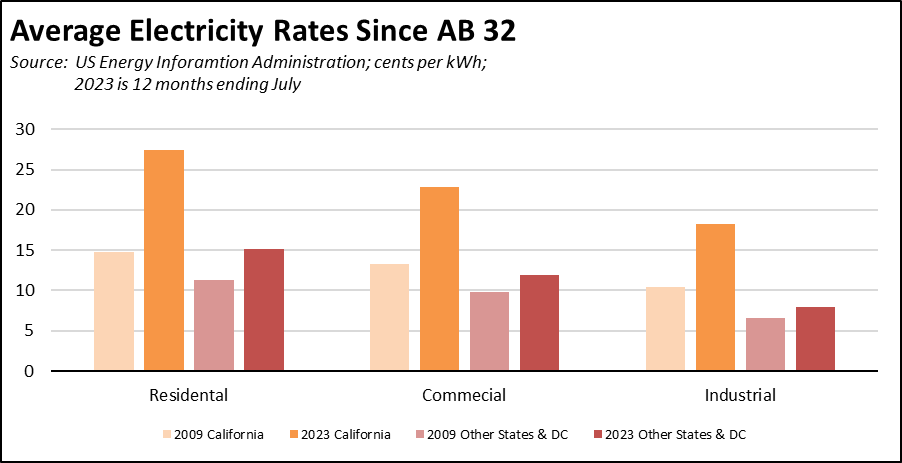
California’s climate change program is moving toward a next generation regulation-heavy command-and-control approach of its economy and the lifestyle of all Californians. While achieving results that are no better or worse than the other states, California’s program has resulted in energy prices that are the highest or near the highest in the nation. While utility providers have demonstrated commendable adaptability and responsiveness in swiftly aligning with the laws and regulations directed by the governor, the Legislature, and state agencies, California’s presumed climate leadership has produced more costs than emission results since the current program began in 2010.
In California, average residential electricity rates have risen 85.7% since 2009 compared to 34.0% in the other states. Average commercial rates have gone up 72.3% vs. 20.9%, and average industrial rates up 75.2% vs. 20.1%. As a result, the annual average residential electricity bill went from 37th highest among the contiguous states in 2009, to 16th highest in the latest data for 12 months ending July 2023. At $1,727 in the most recent (12-month moving average) data, California’s average annual electricity bill is now 5.1% higher than the average for the other states even with its generally more moderate climate.
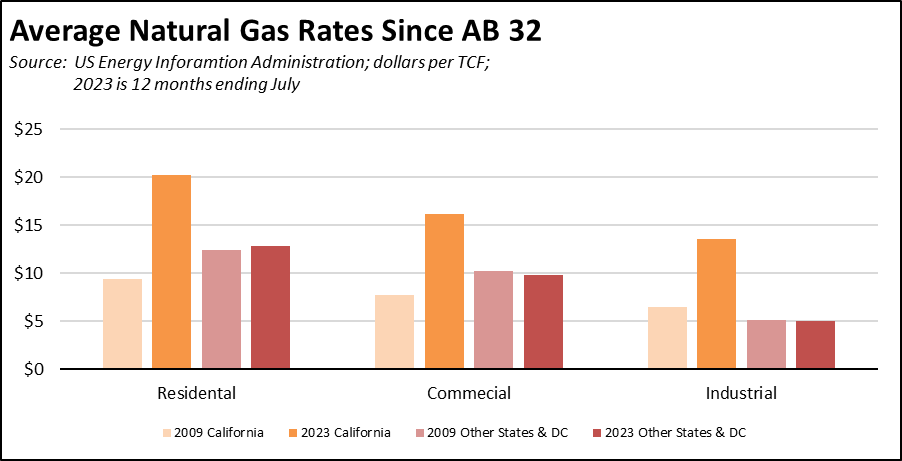
Natural gas prices have experienced more dramatic rises. Annual average residential rates are up 114.3% vs. 2.9% for the other states. Average commercial rates are up 109.3% vs. a 4.5% drop elsewhere, and average industrial rates up 109.7% vs. a 3.3% drop.
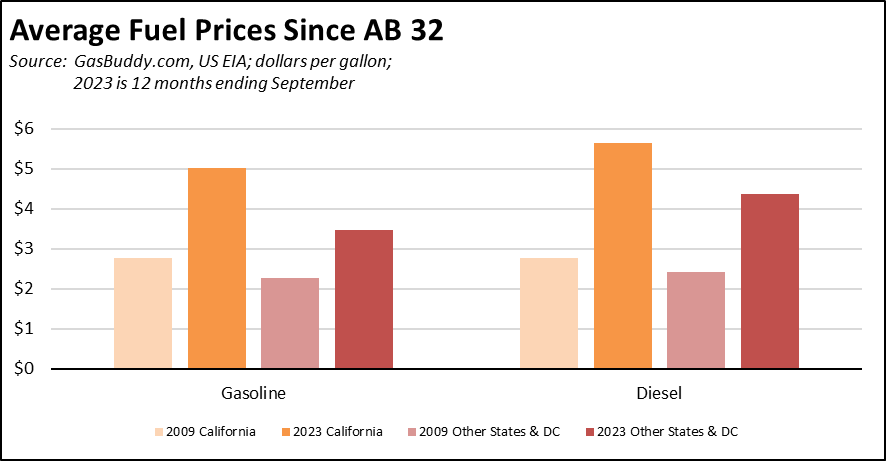
Fuel prices have risen in line with rising oil prices, but have grown more quickly in California as the result of state regulations specifying what fuels can be sold and expansion of fuel taxes and fees. Annual average prices for gasoline are up 80.5% since 2009 in California vs. 52.3% in the other states. Annual average cost of diesel is up 104.3% vs. 81.0%.
“California has shown the world that climate action and economic growth can work hand in hand.” – California's Economic Growth Relies on Imports from Just a Few Countries
The energy base currently underlying the California economy now consists of a diversified mix of energy sources composed of an equally diverse supply base, such as solar, geothermal, wind and hydropower energy resources, produced in-state as well as more broadly in the US and globally. The current transition to dependence on electricity increases reliance on only a few countries that now constitute up to 80% or more of world production and processing of the materials critical to the state’s “clean energy transition.”
California has already experienced over the past quarter century the consequences of limiting energy supplies from its regulations walling off the state from the broader global fuels market prices. As identified in previous reviews by the Attorney General’s Office, these supply restrictions have been the primary factor leading to price volatility within the state during this period.
California’s energy policies now are primed to replicate this experience and apply it to the state’s total energy base as well.
As previously detailed in a 2021 publication by the International Energy Agency and recently highlighted in a CalMatters piece on the governor’s trip to China, the materials required for batteries, transmission links, transformers, and clean energy generation equipment are highly concentrated within a few countries. California’s future economic path is becoming directly dependent on the actions of a few rather than a broad mix of sources, including the willingness of the producing and processing countries to greatly expand these supplies at a time when the US has repeatedly shown it is unwilling to do so within its own boundaries. While the Biden Administration has issued various policy statement attempting to promote greater domestic production of these materials, actions by the federal agencies to delay and deny permits for the required mining continue to stand in direct contradiction to these goals.
The consequent supply and security risks from this future dependence are illustrated by China’s export curbs on graphite announced just prior to the governor’s trip there. Graphite is a critical material for the batteries required for California’s current regulations mandating sale only of zero emission vehicles as well as the storage required to support the shift in the state’s grid to intermittent generation sources. USGS data shows the US with only nominal natural graphite production and reserves, while China currently produces 65% of the global supply. More critically, China currently processes over 80% of the graphite used in batteries.
California GHG Emissions Rise as Economy Slowly Reopened
As reported in the recent state-level greenhouse gas emission (GHG) inventories from US EPA, California’s total GHG emissions rose 5.2% in 2021 to 393.354 MMTCO2e. At this level, state emissions were still 8.7% below 2019, but primarily because the closure of the state economy during the pandemic was not lifted until mid-June in 2021. As a result, emissions are likely to rise again in 2022 and possibly 2023 as the economy, measured by nonfarm jobs, continues its recovery from the pandemic. Results based on full-scale operation of the state economy will consequently not be available until the 2023 numbers are released later this year.
Emissions in 2022 and 2023 are also likely to show some easing due to the large-scale shift to telecommuting. Increases in vehicle miles traveled (VMT) have been behind much of the emissions increase since 2011. Previous regulatory efforts to address this source have never proven effective, and instead only continue to add to the cost of housing and commuting without any tangible environmental benefit. Telecommuting instead has been the only measure producing reductions in VMT and associated emissions but has yet to be incorporated as a market-based measure into the climate program. In 2020, California’s business community proposed a statewide policy to support the Economic Recovery Task Force to expand telecommuting and reduce VMT. The only government action in this regard has been to extend telecommuting to public employees as yet another work benefit while continuing various labor law restrictions that limit broader adoption by the statewide business community.
Summary: Reevaluating California’s High-Regulation, High-Cost Approach
In assessing California’s evolving regulatory strategy, characterized by a growing reliance on inflexible command-and-control measures as the primary means to attain the state’s climate objectives, it becomes evident that this approach falls short. Data from the US EPA underscores that California’s emissions reductions up to 2021 are more closely linked to economic contractions and the disruptions caused by the pandemic, rather than the imposition of increasingly stringent environmental regulations. When compared to other states, California has taken the lead in implementing a continually expanding set of regulatory constraints. However, other states have demonstrated leadership in achieving emissions reductions through alternative, more cost-effective approaches.
Moreover, the escalating regulatory burden in California has led to some of the highest energy rates in the nation, placing a significant burden on residents and businesses, particularly impacting the manufacturing sector and small business owners. California’s expanding reliance on a limited number of countries for clean energy materials raises supply and security risks, exacerbating the state’s energy stability and cost-effectiveness issues, and leaving the state economy vulnerable to artificial shortages and high price volatility in the long term.
The primary concern in shaping the next generation of command-and-control regulation is that it will lead to more costs and fewer results. The analysis of emissions trends suggests that emphasizing market-based mechanisms over rigid regulations can offer a more effective and economically efficient path toward achieving our climate change goals. By shifting toward market-based strategy, California can alleviate the economic burdens associated with extensive regulations, enhancing the potential for a dependable energy future that fulfills the state’s environmental goals and energy demands, promotes job growth, and reduces costs for California families and businesses.
1The EPA inventories spanning from 2000 to the present offer a useful data series enabling comparisons between the states as well as between states and the national results. All data is compiled consistently across all geographies and is done in accordance with IPCC procedures. The full state data is available on the Center’s website.
California’s separate inventory prepared by the Air Resources Board may differ from the EPA numbers for a number of reasons. Looking at 2020, however, the current Air Board estimate is 369.2 MMTCO2e compared to the updated EPA calculation of 373.8, a difference of only 1.2%. The difference with the Air Board’s preliminary estimates for 2021 is slightly higher.
Because they provide a consistent measure across the states, the EPA results provide a useful base from which to assess the credibility of several claims used to justify California’s regulation-intensive approach to climate change issues.