The Center for Jobs and the Economy has released a special report that delves into a critical question: “Was California the 4th Largest Economy in the World in 2022?” This comprehensive report provides insights into California’s economic position, particularly in terms of its global ranking. For additional information and data about the California economy visit www.centerforjobs.org/ca.
Did We Make It?
Nope. Although we did close the gap a little—with California’s economy going from 79% as large as Germany’s in 2021, to 88% as large in 2022—the current projections suggest this is as far as California will go relatively speaking and likely no further at least within the immediate horizon.
In October last year, a Bloomberg opinion piece set the state’s political world abuzz over the prospect of being the 4th largest economy in the world. Putting aside the notion that this conclusion came from conjecture rather than facts or even a formal projection, the state’s leaders quickly took up the claim that California was now Number 4. The Bureau of Economic Analysis release last week of state GDP data for 2022 and the more recent update of the international GDP numbers by the International Monetary Fund (IMF) indicate, however, that this claim was at best premature.
California Remained the 5th Largest Economy in 2021 and 2022
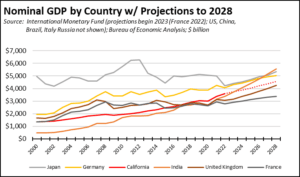
In the most recent GDP numbers for 2022, California if it was a separate economy again would come in as 5th largest, behind Germany but still somewhat ahead of India.
International GDP Rank, Current Prices
Source: International Monetary Fund; US Bureau of Economic Analysis; US dollars, billions
Looking at the IMF projections contained in their release, reaching the Number 4 spot also is not likely within the foreseeable future, even taking into consideration the effects of Russia’s invasion of Ukraine and recent gyrations in energy supply and prices. Based on these projections:
- In order to surpass Germany by 2028, California’s GDP (nominal dollars) would have to grow annually by an average above 5.8%.
- In order to move up to Number 4—India is in fact moving into this position rather than California—GDP would have to grow even faster at an average rate exceeding 6.8%.
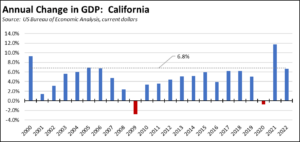
- Since 2000, however, California’s GDP has grown faster than 5.8% in eight years, and faster than 6.8% in only two years including the 2021 growth that was fueled by one-time federal assistance payments—the size of which also helped fuel the current inflation—along with the state finally relaxing its pandemic period closure of jobs. In the previous cycle (2007-2019) prior to the pandemic, California GDP growth (nominal) only averaged 4.0% annually.
- While nominal GDP could grow faster if inflation begins to surge again as was the experience in the 1970s, just assuming a return to the pre-pandemic average of 4.0% growth keeps California behind Germany in the IMF projection period. India in fact overtakes the state, pushing California down to Number 6 sometime beginning this year or next.
Adjusted for Cost of Living, California Drops to 12th Largest
Since 2011, California moved from 10th largest to its current posting of 5th largest economy as measured by nominal GDP. In the process, however, state policies have caused much of that progress to be dissipated by growing costs of living. GDP may be higher, but much of that growth has been diverted into higher costs of living and costs of doing business.
To account for this cost shift, the IMF data also contains a cost of living adjusted GDP measure under their Purchasing Power Parity (PPP) series. To develop a comparable number for California, the GDP current value is adjusted by the Regional Price Parity (RPP) index (all items) series from US Bureau of Economic Analysis. Because the 2022 RPPs will not be available until the end of the year, the 2021 value—essentially equivalent to the average for 2018-2021—is used for both years shown in the following table.
Accounting for the state’s higher costs of living, California instead ranked as the 11th largest economy in the world in 2021, and dipped to 12th highest in 2022.
International GDP Rank, Current PPP
Source: International Monetary Fund; US Bureau of Economic Analysis; international dollars, billions
Can We Get There?
The Bloomberg opinion piece relied heavily on a comparison of resiliency factors in its assessment of the prospects of California vs. Germany in the GDP race. These still exist and can provide a base for stronger growth in the coming years, but current policies also provide a significant and growing drag on growth potential as reflected in the PPP-adjusted rankings. By focusing only on the positive, the Bloomberg piece failed to address the challenge side as well:
- The tech industry gives, but overreliance on one industry can take as well. The state still remains a center of the tech industry, but just as it has had an outsized effect on state GDP and state revenues in the past, that industry’s slowing growth prospects are now having the counter effect. As tracked by Layoffs.fyi, California-based tech companies announced layoffs totaling 38,852 in the fourth quarter just after publication of the Bloomberg piece, and to date in 2023 have announced another 58,827. Other tech companies are slowing their hiring plans, while greater spread of telework means that recovery of these jobs and other future growth no longer will be necessarily tied to persons working in the state.
- The state economy is more than just the tech industry. While wage and salary jobs have grown by just over 3 million since April 2020, 90% of this total replaced the jobs lost by state ordered closures and shifting state policies during the pandemic period. Measured against the pre-pandemic peak, jobs have expanded by only 1.7%, a recovery measure that falls below 20 other states as of the most recent data for February. In absolute terms, California’s net gains of 297,000 are a distant third behind Texas at 860,600 and Florida at 614,300, and just barely ahead of North Carolina at 258,700. If California is ever to reach Number 4, the state needs policies amenable to investment and growth in its broader industries as well. California essentially gave birth to the semiconductor and electric vehicle industries, yet the current well-publicized expansion of those industries and their blue-collar jobs has now turned to an ABC phase—almost anywhere but California.
- Jobs and GDP can’t grow faster without workers. Labor shortages continue to be a constraint on economic growth potential in the state. California lags in putting people back to work and employment in the latest February numbers still falls below the pre-pandemic peak. Vehicle registration data from Department of Motor Vehicles suggests that net migration of people moving out of the state remains at levels near to those in the prior two years.
- Workers can’t take jobs if they cannot afford the housing. While the state has adopted many changes in an effort to boost housing supply, most still focus on rentals and affordable housing rather than the broader range of housing options required to attract and keep workers in the state. Moreover, while many of these changes seek to reduce the cost of new housing construction, additional provisions and restrictions often offset the potential savings with new costs. US Department of Commerce data shows new residential permits in California were for only 113,000 units in 2022, well below the annual requirement and up only marginally from 110,000 in 2019. Texas in 2022 showed 261,000, while Florida came in second with 206,000.
- Workers can’t take jobs if they cannot get to them. Even prior to the pandemic, commuters were turning increasingly to use of their own vehicles out of economic necessity, while use of public transit and the other “active transportation” modes pushed by state policies and infrastructure investments was fading. This trend was accelerated by the pandemic, with no signs of a potential shift. Yet, state policy is now focused on replacing current transportation favored by workers with electric vehicles with an average cost as of February at $58,385 and fuel costs—whether gasoline or electricity—that continue to be the highest or near the highest in the country.
- GDP growth in every developed economy has relied on stable energy supply and prices. California instead has launched an experiment with policies that have pushed fuel and utility prices to the highest or near highest among the contiguous states. Prices are now at levels that raise into question the ability of many households to afford them going forward. Commercial and industrial rates and fuel prices well above the national averages due to state policies feed into the cost of goods and services, adding continued inflationary pressures on households and undermining the competitive stance of businesses outside the tech industry.