Below are highlights from the recently released trade data from the US Census Bureau and US Bureau of Economic Analysis.
The April data includes the annual revisions to prior years, in this case revisions going back to 2017. Changes to the California numbers were relatively minor, with export flows somewhat higher and import flows somewhat lower over the three years showing revisions. The changes to trade activities by state businesses were even less significant.
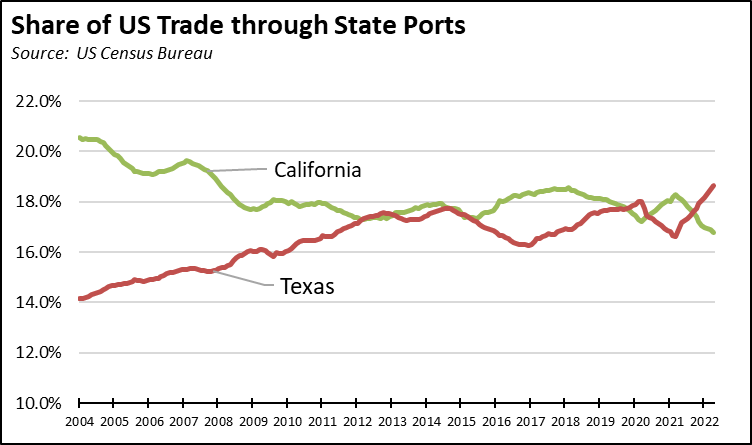
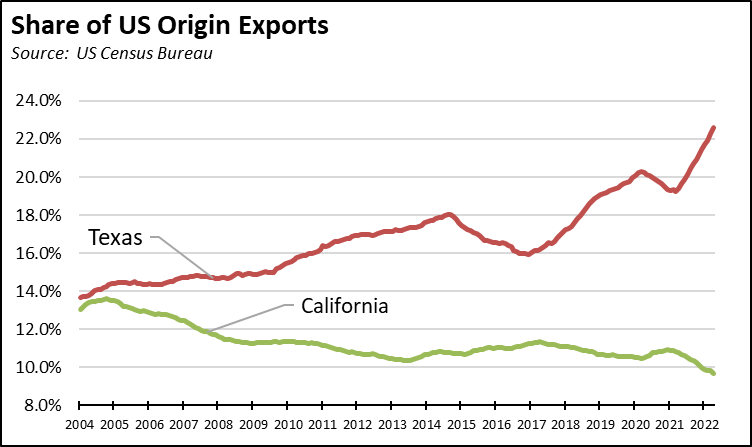
The revisions also had only a minor effect on the two metrics tracking the state’s relative position in trade. California, however, continued to lose ground to Texas as the number one state measured by both the total trade flow through state ports and share of total US exports.
The April data in general saw a softening in trade compared to the prior month, with origin exports down 6.6% and destination imports down somewhat more at 10.0%. In real terms, state exports were down 3.3% from April 2021, but were largely unchanged from pre-pandemic April 2019. Destination imports were up sharply in both periods.
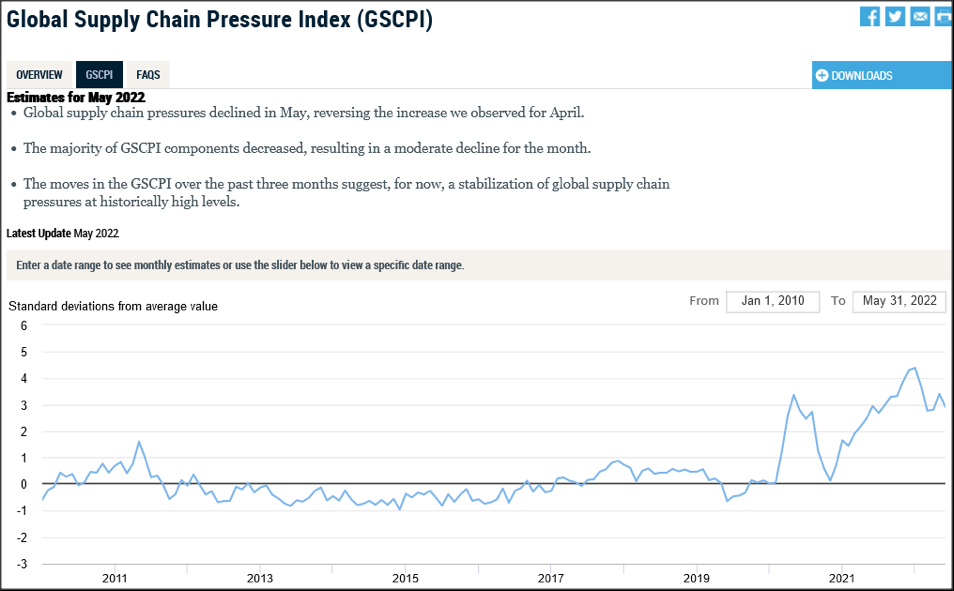
Overall, the New York Federal Reserve’s Global Supply Chain Pressure Index shows global conditions easing only slightly from peak congestion in December 2021. Global conditions have essentially leveled off in the past few months, but at historically high levels.
Source: New York Federal Reserve Bank
Within California, the latest results saw a total of 30 container ships in the backup off Los Angeles and Long Beach on June 3. This tracking as well shows improvements from the 71 container ships and 108 total ships at anchor or loitering off the ports on October 20, 2021, when the state issued its measures to tackle the ongoing supply chain issues.
In both instances, congestion is down, but the issue is that congestion still persists. A continuing prime source of disruption has been the draconian closures in China, but this situation has also helped ease pressures at this point in the supply chain through reductions in the import flows. The core problems still remain and leave the supply chain vulnerable to renewed disruptions during the upcoming shipping rush prior to the year-end holidays, a period that now looks likely to be extended as companies attempt to get a jump on the product shortages experienced last year due to shipping delays. Adding to the risks are the still unresolved contract talks with the West Coast port workers—although there are indications the federal government has been working to keep ports open until an agreement can be reached—sharply rising diesel costs that are affecting overall truck supply and shipping operations, continued backlogs in container buildups both within the ports and offsite as containers are moved to avoid potential fines, and the threat of renewed congestion as the lockdowns in China are finally lifted.
In addition to these factors, California remains on course to impose additional barriers through self-inflicted regulations. Even as the state continues to lag the rest of the country in economic recovery, the agencies continue to work on regulations adding to the comparative cost disadvantages for this core component of middle-class, blue-collar jobs. In just one particular instance, the Harbor Trucking Association expects that the state’s Advanced Clean Truck rule will see a 24% drop up front in the availability of trucks needed to handle freight within the ports.
The pandemic period in essence provided a stress test probing the weak points in the current supply chain. While the current period appears to have produced some easing in the overall incidence of problems, the core problems remain and are likely to result in a renewed round of disruption in the coming months.
California Goods Exports
Total California goods exports were up $0.7 billion in nominal terms from April 2021 (up 4.7%). California remained in 2nd place with 9.7% of all US goods exports (12 month moving total), behind Texas at 22.59%.
California's Balance for Goods Trade
California’s balance of goods trade activity through state businesses broadened to -$26.8 billion, compared to a level of -$22.4 billion in April 2021. California trade accounted for 27% of the US trade deficit in goods in April 2022.
Top 20 Exports, April 2022
Top 20 exports by value are shown below, along with the change from April 2021.