Below are highlights from the recently released April trade data from the US Census Bureau and US Bureau of Economic Analysis. This month’s release also includes the annual revisions, with changes to the data beginning in 2020. To view additional data and analysis related to the California economy visit our website at www.centerforjobs.org/ca.
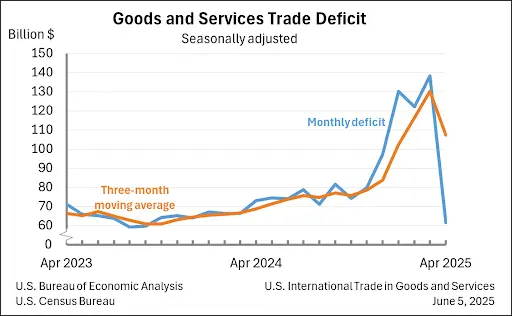
Overall, the national trade deficit declined substantially, with goods and services exports up $8.3 billion from March and imports dropping after the recent goods surges by $68.4 billion. These results, however, indicate much of the goods movement in recent months reflects acceleration of shipments that otherwise would have occurred in April and the upcoming months.
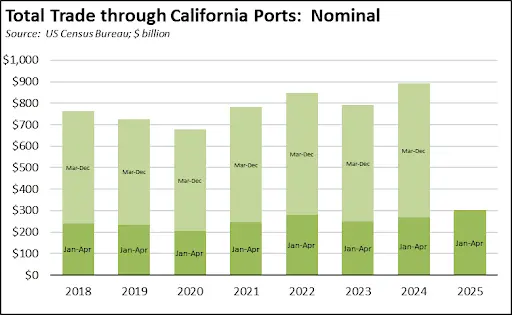
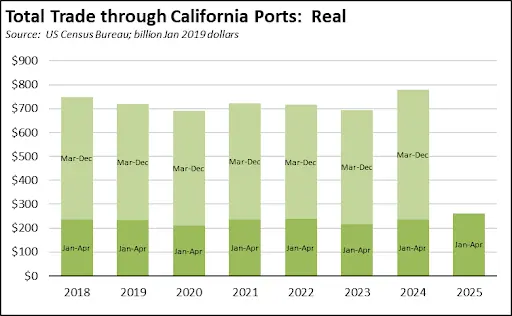
For California, total goods trade activity through the state’s ports remained elevated in April, up $3.2 billion (4.4%) from April 2024. Origin exports rose $680 million (4.7%) while destination imports fell $1.3 billion (-3.3%). Overall, however, the surge in trade activity in the first 4 months of the year due to federal tariff activity saw the highest trade levels for the state’s ports measured in both nominal and real terms. Early reports from the Ports of Long Beach and Los Angeles, however, indicate lower activity in May even with the pause of tariffs.
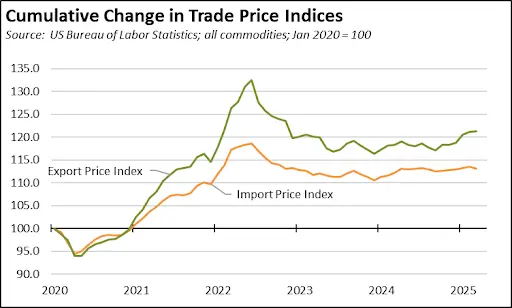
Prices remained relatively stable in April but with import prices sustaining their recent marginal upward movement.
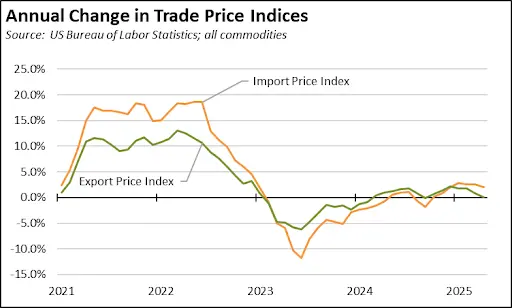
These trends, however, largely reflect longer term ones rather than showing any effects yet from current tariff policies. Import prices have remained elevated at a relatively stable level since 2023. Export prices largely reflect the same pattern but with an uptick in recent months.
California Goods Exports
in Exports
Total California origin goods exports were up $0.7 billion from April 2024 (up 4.7%). California remained in 2nd place with 8.98% of all US goods exports (12 month moving total), behind Texas at 21.76%.
California Goods Imports
in Imports
Total California destination goods imports dropped $1.3 billion from April 2024 (down 3.3%).
Top 20 Exports, April 2025
Top 20 exports by value are shown below, along with the change from Apr 2024.