Download Report Below are highlights from the recently released trade data from the US Census Bureau and US Bureau of Economic Analysis. To view additional data and analysis related to the California economy visit our website at www.centerforjobs.org/ca.
With the West Coast labor situation resolved, the ports can now turn their attention to regaining lost traffic and the associated blue collar and related jobs that rely on this activity. Unfortunately, moving beyond this point also means the ports must now focus on other threats to this core jobs base, including the continued rise in operating costs especially energy and new regulatory threats that would place a cap on allowable port activity in the state.
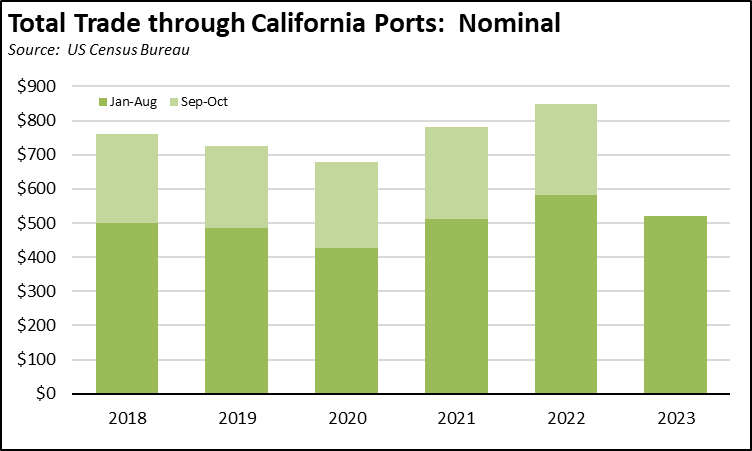
The August trade results show a weakening in trade activity, reflecting both the challenges to trade in the state along with overall softening in the global trade numbers. In nominal terms, origin exports were down 6.2% from August 2022, destination imports down 10.7%, and overall trade through the state’s ports off 7.8%. Year-to-date, however, total trade through the state’s ports has been somewhat higher than the pre-pandemic years, although lower than the same period in 2022.
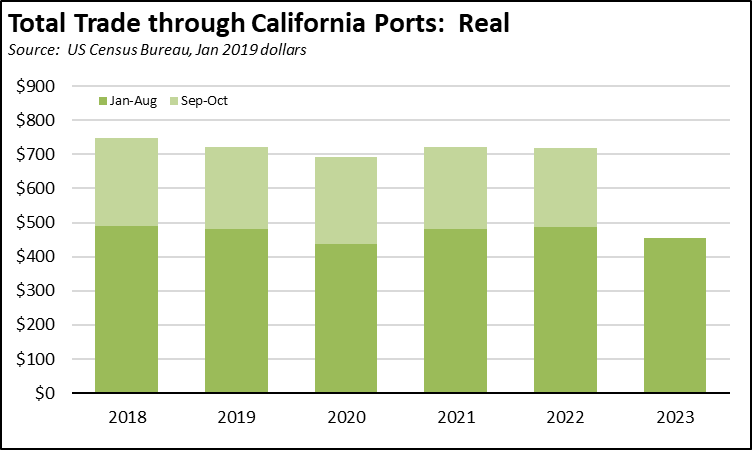
Accounting for the high inflation in recent years, however, total trade through the state’s ports has yet to return to the pre-pandemic levels. Through August, year-to-date trade is off 5.6% from the same period in 2019 in real terms (Jan 2019 dollars), and off 7.2% from the same period in 2018.
Share of Goods through US Ports
15.3%
CA Share Of Total Trade
Through US Ports
The share of total US goods trade (exports and imports) through California ports continued its downward trend to 15.32% (12 month moving average; compared to 15.36% in July 2023 and 16.41% in August 2022).
California remained the #2 state, behind Texas with 20.11% (compared to 20.07% in July 2023 and 19.38% in August 2022). Trade through the Atlantic port states was at 30.09% (compared to 30.05% in July 2023 and 29.6% in August 2022). Although declining, the state’s position as a leading trade portal forms the trade-related base for one of California’s largest centers of middle-class, blue-collar jobs. Transportation & Warehousing alone provided 796,500 in the most recent data for August 2023, and was the only industry at this wage level showing expansion during the pandemic.
California Goods Exports
-$1.0
Billion Change In Exports
Total California goods exports were down $1.0 billion from August 2022 (down 6.2%). California remained in 2nd place with 8.84% of all US goods exports (12 month moving total), behind Texas at 22.22%.
California Goods Imports
-$4.6
Billion Change In Imports
Total California destination goods imports fell $4.6 billion from August 2022 (down 10.7%).
Top 20 Exports, June 2023
Top 20 exports by value are shown below, along with the change from August 2022.
| NAICS Commodity | Aug 2023 Exports ($b.) | Change from Aug 2022 |
| Semiconductors & Other Electronic Components | $1.0 | 7.3% |
| Computer Equipment | 0.9 | 18.0% |
| Navigational/measuring/medical/control Instrument | 0.8 | -0.8% |
| Aerospace Products & Parts | 0.8 | -0.5% |
| Fruits & Tree Nuts | 0.7 | -10.8% |
| Pharmaceuticals & Medicines | 0.7 | -16.2% |
| Communications Equipment | 0.6 | 21.3% |
| Medical Equipment & Supplies | 0.6 | 18.4% |
| Miscellaneous Manufactured Commodities | 0.5 | -25.5% |
| Petroleum & Coal Products | 0.5 | -2.6% |
| Industrial Machinery | 0.5 | -54.1% |
| Electrical Equipment & Components, Nesoi | 0.4 | 9.6% |
| Waste & Scrap | 0.4 | -11.9% |
| Other General Purpose Machinery | 0.3 | 4.8% |
| Motor Vehicles | 0.3 | 17.8% |
| Motor Vehicle Parts | 0.3 | 11.6% |
| Other Fabricated Metal Products | 0.3 | 17.0% |
| Used Or Second-hand Merchandise | 0.3 | -4.4% |
| Foods, Nesoi | 0.2 | -20.5% |
| Plastics Products | 0.2 | -8.8% |
| | |
Top 10 Export Markets, August 2023
| Country | Aug 2023 Exports ($b.) | Change from Aug 2022 |
| Mexico | $3.0 | 8.3% |
| Canada | 1.5 | -3.9% |
| China | 1.2 | -24.0% |
| Japan | 0.8 | -7.4% |
| Taiwan | 0.8 | -14.8% |
| Korea, South | 0.7 | -49.6% |
| Netherlands | 0.6 | 20.3% |
| Hong Kong | 0.5 | 7.3% |
| Germany | 0.5 | -22.4% |
| Hong Kong | 0.4 | -19.3% |
| | |