Below are highlights from the recently released trade data from the US Census Bureau and US Bureau of Economic Analysis. To view additional data and analysis related to the California economy visit our website at www.centerforjobs.org/ca.
The Baltimore bridge collapse is the latest event adding to global trade disruptions, coming on the heels of continued challenges to shipping through the Panama and Suez Canals, uncertainty in the global economic outlook, and the shift of extended contract negotiations to the Eastern ports. No date has yet been set on when channel clearing will allow the affected Baltimore terminals to reopen, but so far other East Coast ports appear to be able to handle the diverted cargo shipments due to the capacity expansions—both terminals and associated warehouse and intermodal links—they have completed in recent years to compete directly with West Coast ports. The economic effects will still be heavily borne by Baltimore and its port and related trade sector workers.
Conversely, the initial reads suggest China’s economy may have bottomed out and may be poised for expansion in the rest of the year, and the other factors appear to be supporting a gradual climb in overall market share handled by the state’s ports. On a 12-month moving average basis, the state’s share of total US goods trade (by value) has risen for six months since the series low hit last August. While this shift may reflect a “no where to go but up” situation after the series of events and factors causing the market share losses, it is a welcome trend supporting the state’s only center of blue-collar, middle-class wage jobs growth. This upside trend, however, remains under challenge by the portion of the world’s container ship fleet capable of serving the state’s ports due to current and looming state and local rules.
Measured in constant dollars, exports through California ports remain somewhat depressed, but still some improvement over the prior two years.

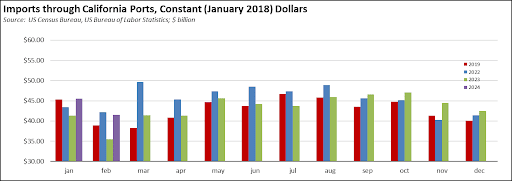
Imports instead have been somewhat stronger due to the factors above, but the February numbers are affected by both changes in shipping due to the Lunar New Year holiday period (February 10 to 17 in China in 2024) and the additional day this year in February.
California Goods Exports
Total California goods exports were up $0.4 billion from February 2023 (up 2.6%). California remained in 2nd place with 8.8% of all US goods exports (12 month moving total), behind Texas at 22.12%.
California Goods Imports
Total California destination goods imports rose $2.6 billion from February 2023 (up 8.1%).
Top 20 Exports, February 2024
Top 20 exports by value are shown below, along with the change from Feb 2023.