Download Report
Below are highlights from the recently released trade data from the US Census Bureau and US Bureau of Economic Analysis. To view additional data and analysis related to the California economy visit our website at www.centerforjobs.org/ca.
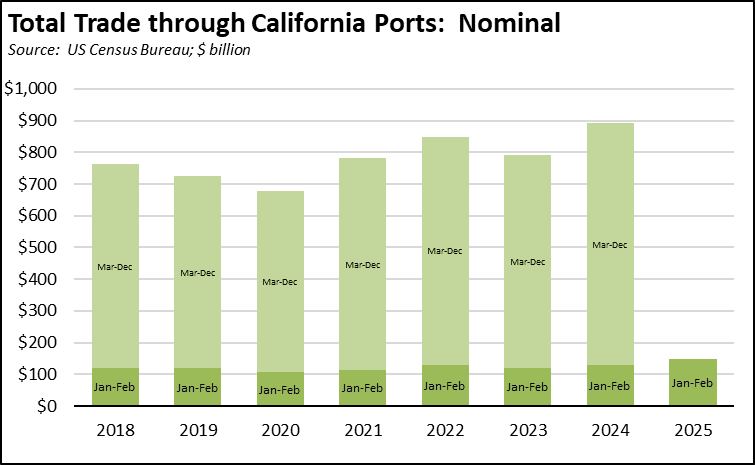
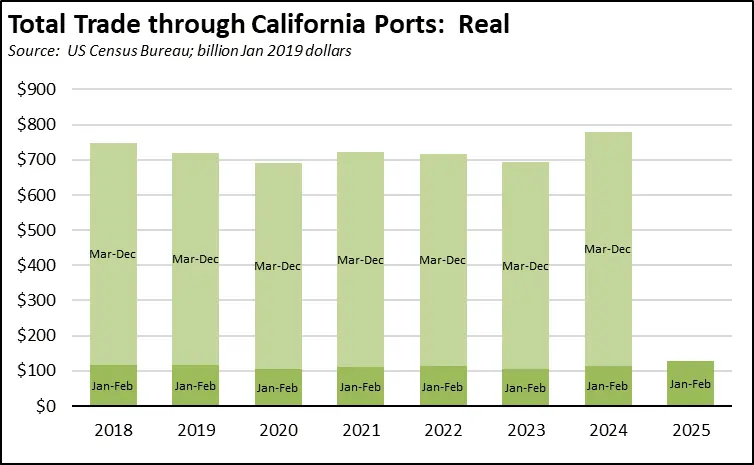
Trade flows in the first two months of 2025 were heavily affected by two factors: accelerated inventory shipments in an effort to stay ahead of the recently imposed tariffs and the annual shifts due to the Chinese New Year holiday in China, which this year straddled both January and February. Total trade through the state’s ports in the first two months was up 14.9% from the same period in 2024 in nominal terms, and up 12.7% in real terms. Both measures represent a new high in trade activity.
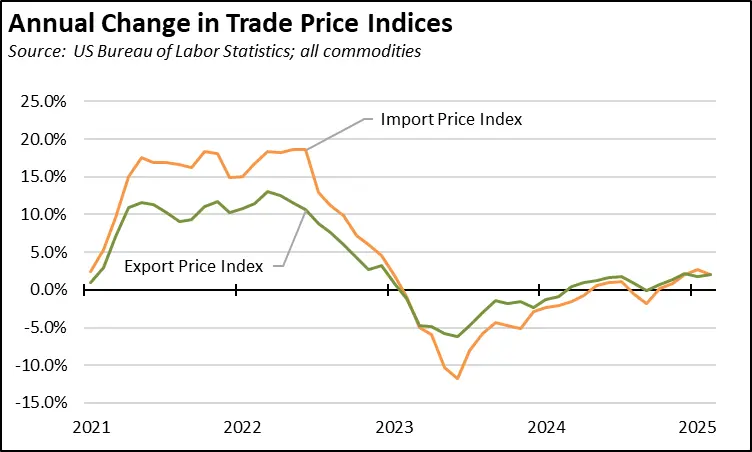
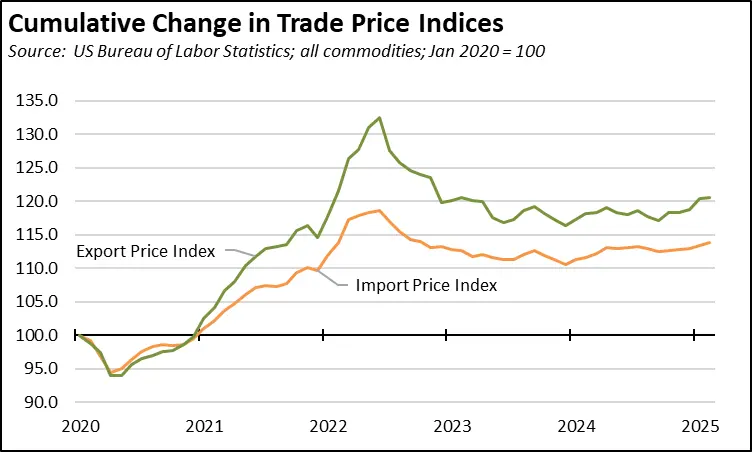
With imposition of the new tariffs, concerns over the effect on prices also remain high. Rapid upswings in import prices during the pandemic due to shortages and supply chain congestion contributed heavily to the rise of inflation during this period. However, trade good prices have already been rising. After a period of relative price stability (as measured by the indices for all commodities), both import and export prices began rising again last September. Import prices in this period rose at an annualized rate of 7.3%. Export prices rose somewhat faster.
Share of Goods through US Ports
16.7%
CA Share of Total Trade
Through US Ports
The share of total US goods trade (exports and imports) through California ports dipped back to 16.73% (12 month moving average; compared to 16.77% in January 2025 and 15.67% in February 2024).
California remained the #2 state, behind Texas which had a 19.65% share (compared to 19.81% in January 2025 and 20.15% in February 2024). Trade through the Atlantic port states was at 29.65% (compared to 29.38% in January 2025 and 29.96% in February 2024). These trade flows form the trade-related base for one of California’s largest centers of middle-class, blue-collar jobs. Transportation & Warehousing alone provided 771,100 jobs in February 2025, compared to 758,100 in February 2024.
California Goods Exports
$1.0
Billion Change
in Exports
Total California origin goods exports rose $1.0 billion from February 2024 (up 7.3%). California remained in 2nd place with 8.97% of all US goods exports (12 month moving total), behind Texas at 22.03%.
California Goods Imports
$0.8
Billion Change
in Imports
Total California destination goods imports grew $0.8 billion from February 2024 (up 2.4%).
Top 20 Exports, February 2025
Top 20 exports by value are shown below, along with the change from February 2024.
| NAICS Commodity | February 2025 Exports ($b.) | Change from December 2023 |
|---|
| Computer Equipment | $1.3 | 18.8% |
| Pharmaceuticals & Medicines | 1.0 | 89.9% |
| Fruits & Tree Nuts | 0.9 | -5.6% |
| Navigational/measuring/medical/control Instrument | 0.9 | 9.4% |
| Aerospace Products & Parts | 0.8 | 26.9% |
| Semiconductors & Other Electronic Components | 0.6 | -8.7% |
| Miscellaneous Manufactured Commodities | 0.6 | 7.6% |
| Medical Equipment & Supplies | 0.6 | 10.1% |
| Communications Equipment | 0.5 | -8.4% |
| Electrical Equipment & Components, Nesoi | 0.5 | 4.9% |
| Petroleum & Coal Products | 0.4 | 0.5% |
| Industrial Machinery | 0.4 | -13.3% |
| Other General Purpose Machinery | 0.4 | 39.2% |
| Commercial & Service Industry Machinery | 0.4 | 12.4% |
| Used Or Second-hand Merchandise | 0.3 | 32.5% |
| Other Fabricated Metal Products | 0.3 | 22.9% |
| Motor Vehicle Parts | 0.3 | 64.3% |
| Waste & Scrap | 0.3 | -7.0% |
| Foods, Nesoi | 0.2 | -0.5% |
| Electrical Equipment | 0.2 | 17.1% |
| | |
Top 10 Export Markets, February 2025
| Top 10 Commodities in Top 5 California Export Markets, 2024 | | | |
|---|
| Source: US Trade Online; $ billion | | |
| Mexico | | EU |
| All Commodities | $33.5 | All Commodities |
| Motor Vehicle Parts | $2.3 | Pharmaceuticals & Medicines |
| Computer Equipment | $1.7 | Computer Equipment |
| Semiconductors & Other Electronic Components | $1.5 | Fruits & Tree Nuts |
| Electrical Equipment & Components, Nesoi | $1.5 | Navigational/measuring/medical/control Instrument |
| Other General Purpose Machinery | $1.3 | Medical Equipment & Supplies |
| Navigational/measuring/medical/control Instrument | $1.3 | Aerospace Products & Parts |
| Plastics Products | $1.2 | Communications Equipment |
| Other Fabricated Metal Products | $1.1 | Semiconductors & Other Electronic Components |
| Apparel | $1.1 | Electrical Equipment & Components, Nesoi |
| Communications Equipment | $1.1 | Used Or Second-hand Merchandise |
| Canada | | China |
| All Commodities | $18.4 | All Commodities |
| Computer Equipment | $2.1 | Commercial & Service Industry Machinery |
| Fruits & Tree Nuts | $1.6 | Navigational/measuring/medical/control Instrument |
| Vegetables & Melons | $1.1 | Semiconductors & Other Electronic Components |
| Communications Equipment | $1.0 | Pharmaceuticals & Medicines |
| Motor Vehicles | $0.9 | Fruits & Tree Nuts |
| Electrical Equipment & Components, Nesoi | $0.7 | Waste & Scrap |
| Navigational/measuring/medical/control Instrument | $0.6 | Industrial Machinery |
| Foods, Nesoi | $0.5 | Computer Equipment |
| Miscellaneous Manufactured Commodities | $0.5 | Motor Vehicles |
| Audio & Video Equipment | $0.5 | Medical Equipment & Supplies |
| Japan | | |
| All Commodities | $15.1 | |
| Aerospace Products & Parts | $1.5 | |
| Navigational/measuring/medical/control Instrument | $1.3 | |
| Industrial Machinery | $1.2 | |
| Pharmaceuticals & Medicines | $0.8 | |
| Fruits & Tree Nuts | $0.8 | |
| Medical Equipment & Supplies | $0.8 | |
| Communications Equipment | $0.8 | |
| Commercial & Service Industry Machinery | $0.6 | |
| Semiconductors & Other Electronic Components | $0.6 | |
| Grain & Oilseed Milling Products | $0.6 | |
| | | |