Download Report Below are highlights from the recently released trade data from the US Census Bureau and US Bureau of Economic Analysis. To view additional data and analysis related to the California economy, visit our website at www.centerforjobs.org/ca.
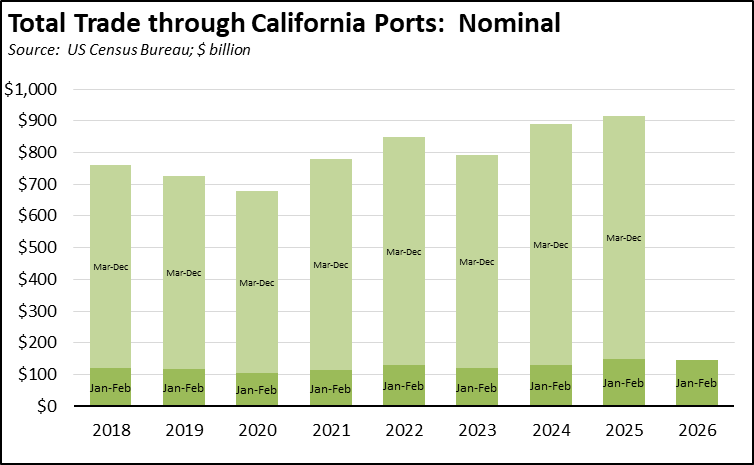
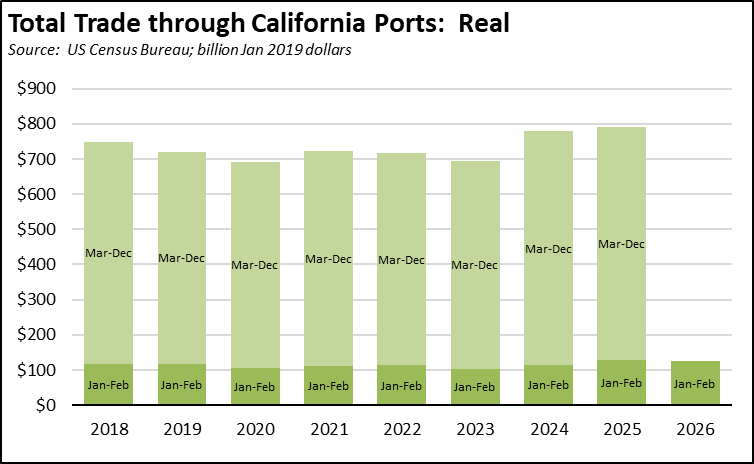
Reflecting the Lunar New Year holiday, total trade through the state’s ports dropped $9.0 billion (-11.5%) from January, but was essentially unchanged from February 2025. Measured in current dollars, total trade in the first two months was only marginally lower (-1.8%) than the same period in 2026, but was off 3.4% measured in constant dollars.
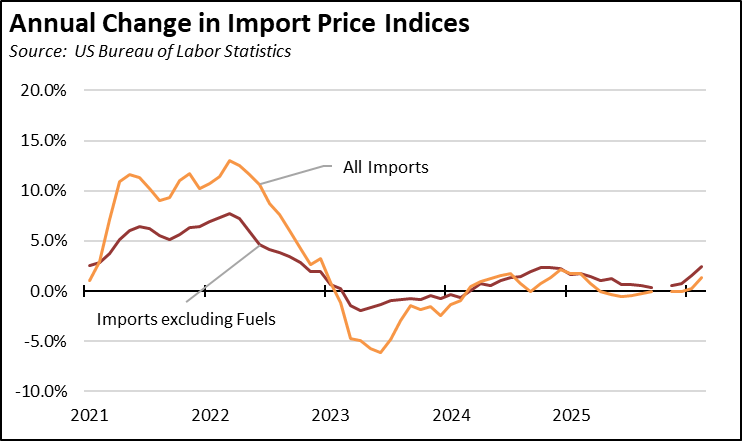
These results reflect a recent surge in import prices combined with the ongoing rise in export prices. At an annualized rate, import prices rose 16.3% in February, the highest level since 2022. Export prices were higher at an annualized rate of 20.2%, also the highest since 2022.
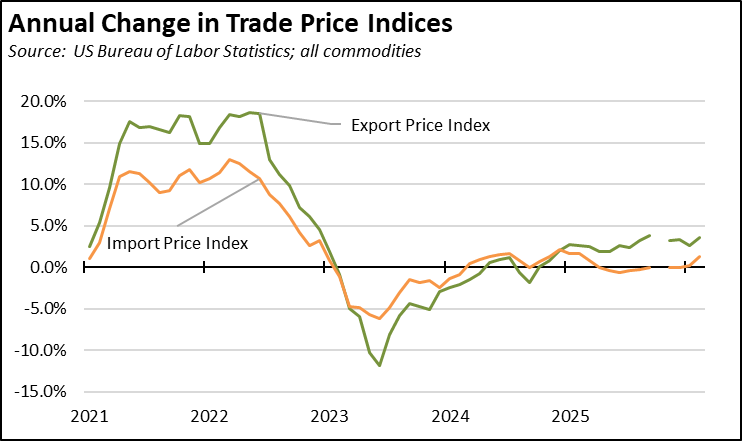
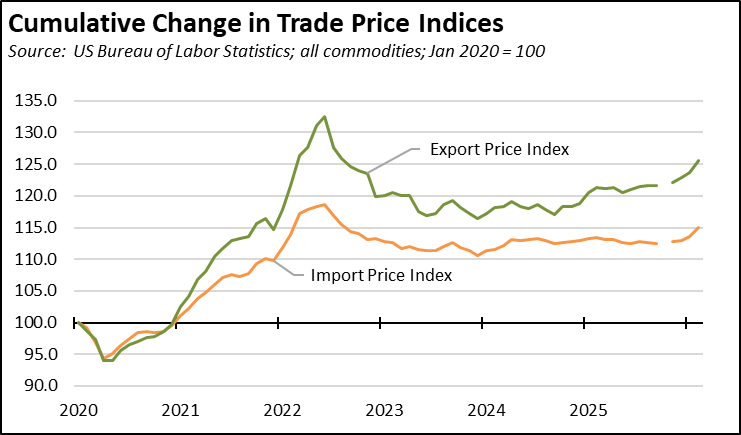
Imports less the more volatile fuels component was only slightly lower, at an annualized rate of 13.5% in February following on January’s 9.6% rise. While the full effect of tariffs was not reflected in import prices through much of last year, this situation is now turning and is likely to be replaced by the impact of fuel costs on trade.
Share of Goods through US Ports
16.4%
CA Share of Total Trade
Through US Ports
The share of total US goods trade (exports and imports) through California ports edged up to 16.42% (12 month moving average; compared to 16.40% in January 2026 and 16.74% in February 2025).
California remained the #2 state, behind Texas which had a 20.39% share (compared to 20.19% in January 2026 and 19.62% in February 2025). Trade through the Atlantic port states was at 29.46% (compared to 29.72% in January 2026 and 29.68% in February 2025). These trade flows form the trade-related base for one of California’s largest centers of middle-class, blue-collar jobs.
Competition with the other states, however, continues to tighten. Georgia Ports Authority just recently announced the opening of a new inland port facility that will enable faster movement of goods through the Port of Savannah. In contrast to California’s command and control approach, the facility will also have a significant air quality benefit by enabling movement of goods from truck to rail more quickly.
California Goods Exports
$0.5
Billion Change
in Exports
Total California origin goods exports were up $0.5 billion from February 2025 (up 3.1%). California remained in 2nd place with 8.45% of all US goods exports (12 month moving total), behind Texas at 20.3%.
California Goods Imports
-$0.1
Billion Change
in Imports
Total California destination goods imports eased $0.1 billion from February 2025 (down -0.3%).
Top 20 Exports, February 2026
Top 20 exports by value are shown below, along with the change from Feb 2025.
| NAICS Commodity | Feb 2026 Exports ($b.) | Change from Feb 2025 |
|---|
| Computer Equipment | $1.4 | 11.6% |
| Fruits & Tree Nuts | 1.2 | 38.3% |
| Aerospace Products & Parts | 0.9 | 20.4% |
| Pharmaceuticals & Medicines | 0.9 | -12.3% |
| Semiconductors & Other Electronic Components | 0.8 | 31.9% |
| Navigational/measuring/medical/control Instrument | 0.7 | -14.2% |
| Communications Equipment | 0.7 | 25.3% |
| Nonferrous (exc Alum) & Processing | 0.6 | 369.0% |
| Medical Equipment & Supplies | 0.5 | -18.8% |
| Commercial & Service Industry Machinery | 0.4 | 5.2% |
| Electrical Equipment & Components, Nesoi | 0.4 | -23.3% |
| Waste & Scrap | 0.4 | 24.6% |
| Miscellaneous Manufactured Commodities | 0.3 | -41.5% |
| Industrial Machinery | 0.3 | -15.8% |
| Petroleum & Coal Products | 0.3 | -22.1% |
| Other Fabricated Metal Products | 0.3 | -10.6% |
| Motor Vehicle Parts | 0.3 | -10.2% |
| Other General Purpose Machinery | 0.2 | -34.4% |
| Foods, Nesoi | 0.2 | 5.8% |
| Dairy Products | 0.2 | 31.0% |
| | |
Top 10 Export Markets, February 2026
| Feb 2026 Exports ($b.) | Change from Feb 2025 |
|---|
| Mexico | $2.6 | -14.9% |
| Taiwan | 1.2 | 64.2% |
| Canada | 1.1 | -25.9% |
| Japan | 0.8 | -4.3% |
| Korea, South | 0.7 | -17.2% |
| China | 0.6 | -26.5% |
| Netherlands | 0.6 | 9.4% |
| Germany | 0.6 | 11.5% |
| Singapore | 0.5 | 27.6% |
| United Kingdom | 0.4 | -23.3% |
| | |