Download Report
Below are highlights from the recently released trade data from the US Census Bureau and US Bureau of Economic Analysis. To view additional data and analysis related to the California economy visit our website at www.centerforjobs.org/ca.
Trade levels in general showed improvement as the California ports continued to recover some of the market share lost during the uncertainty generated during the extended labor negotiations. On a 12-month moving average basis, California’s share of total US goods trade rose for the 6th month in a row, but still remained below the pre-pandemic level and just under a quarter below the series high of 20.6%. In constant dollars, exports inched up compared to a year ago, but also were well below the pre-pandemic level. Imports, in contrast, passed the pre-pandemic mark.
Share of Goods through US Ports
15.6%
CA Share of Total Trade
Through US Ports
The share of total US goods trade (exports and imports) through California ports edged up to 15.61% (12 month moving average; compared to 15.52% in December 2023 but down from 15.91% in January 2023).
California remained the #2 state, behind Texas with 20.04% (compared to 20.06% in December 2023 and 19.82% in January 2023). While California’s overall rank now is firmly in second place, Trade continues to be the most significant, growing source of middle-class, blue-collar jobs. Transportation & Warehousing alone provided 862,000 in the latest results from December, along with additional jobs in the range of support industries.
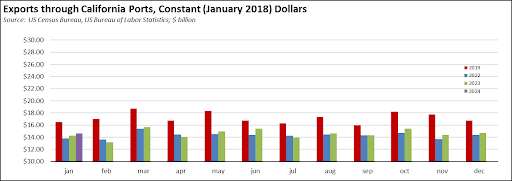
California Goods Exports
-$1.1
Billion Change in Exports
Total California goods exports were down $1.1 billion from January 2023 (down 7.4%). California remained in 2nd place with 8.82% of all US goods exports (12 month moving total), behind Texas at 22.08%.
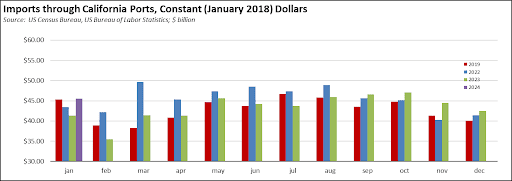
California Goods Imports
$0.8
Billion Change in Imports
Total California destination goods imports rose $0.8 billion from January 2023 (up 2.2%).
Top 20 Exports, January 2024
Top 20 exports by value are shown below, along with the change from Jan 2023.
| NAICS Commodity |
Jan 2023 Exports ($b.) |
Change from Jan 2023 |
| Computer Equipment |
$1.0 |
39.2% |
| Fruits & Tree Nuts |
0.8 |
30.9% |
| Semiconductors & Other Electronic Components |
0.8 |
14.7% |
| Navigational/measuring/medical/control Instrument |
0.8 |
4.2% |
| Pharmaceuticals & Medicines |
0.7 |
-63.4% |
| Aerospace Products & Parts |
0.7 |
2.8% |
| Communications Equipment |
0.6 |
-5.2% |
| Petroleum & Coal Products |
0.5 |
-19.7% |
| Medical Equipment & Supplies |
0.5 |
4.4% |
| Electrical Equipment & Components, Nesoi |
0.5 |
39.5% |
| Miscellaneous Manufactured Commodities |
0.5 |
-8.8% |
| Industrial Machinery |
0.4 |
-10.6% |
| Waste & Scrap |
0.3 |
-2.6% |
| Motor Vehicles |
0.3 |
57.1% |
| Commercial & Service Industry Machinery |
0.3 |
12.4% |
| Other General Purpose Machinery |
0.3 |
-1.8% |
| Other Fabricated Metal Products |
0.3 |
1.2% |
| Foods, Nesoi |
0.2 |
3.7% |
| Basic Chemicals |
0.2 |
-33.6% |
| Plastics Products |
0.2 |
-10.1% |
|
|
|
Top 10 Export Markets, January 2024
| Country |
Jan 2024 Exports ($b.) |
Change from Jan 2023 |
| Mexico |
$2.5 |
-8.3% |
| Canada |
1.4 |
33.8% |
| China |
1.2 |
12.2% |
| Taiwan |
0.8 |
15.7% |
| Japan |
0.8 |
-13.9% |
| Taiwan |
0.8 |
-6.6% |
| Germany |
0.6 |
25.7% |
| Netherlands |
0.5 |
3.5% |
| Hong Kong |
0.4 |
35.5% |
| Australia |
0.4 |
29.5% |
|
|
|