Download Report Below are highlights from the recently released trade data from the US Census Bureau and US Bureau of Economic Analysis. To view additional data and analysis related to the California economy visit our website at www.centerforjobs.org/ca.
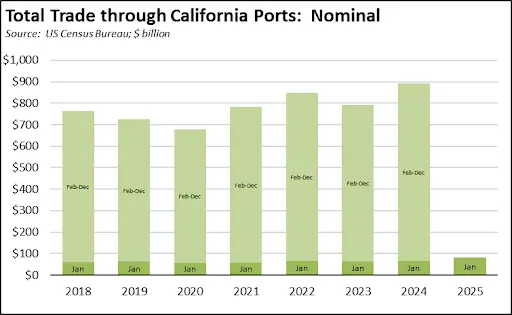
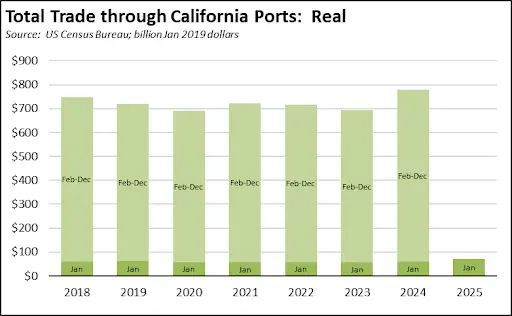
Trade through the state’s ports continued to surge in January as shippers sought to stay ahead of pending tariffs. Compared to January 2024, total trade flows in January 2025 were up $13.5 billion in nominal terms (20.2%), with the largest component coming from imports ($11.9 billion). Origin exports from the state’s businesses were up $1.1 billion (7.8%), and destination imports into the state were up $8.8 billion (25.7%).
Share of Goods through US Ports
16.8%
CA Share of Total Trade
Through US Ports
The share of total US goods trade (exports and imports) through California ports edged up to 16.77% (12 month moving average; compared to 16.73% in December 2024 and 15.60% in January 2024).
California remained the #2 state, behind Texas which had a 19.81% share (compared to 19.99% in December 2024 and 20.11% in January 2024). Trade through the Atlantic port states was at 29.38% (compared to 29.16% in December 2024 and 30.02% in January 2024). These trade flows form the trade-related base for one of California’s largest centers of middle-class, blue-collar jobs.
California Goods Exports
$1.1
Billion Change
in Exports
Total California origin goods exports were up $1.1 billion from January 2024 (up 7.8%). California remained in 2nd place with 8.92% of all US goods exports (12 month moving total), behind Texas at 22.05%.
California Goods Imports
$6.2
Billion Change
in Imports
Total California destination goods imports grew $6.2 billion from January 2024 (up 16.9%).
Top 20 Exports, January 2025
Top 20 exports by value are shown below, along with the change from Jan 2024.
| NAICS Commodity | December 2024 Exports ($b.) | Change from December 2023 |
|---|
| Computer Equipment | $1.3 | 24.1% |
| Aerospace Products & Parts | 1.2 | 79.2% |
| Semiconductors & Other Electronic Components | 0.9 | 6.2% |
| Fruits & Tree Nuts | 0.8 | 0.0% |
| Navigational/measuring/medical/control Instrument | 0.8 | -4.4% |
| Electrical Equipment & Components, Nesoi | 0.7 | 44.0% |
| Pharmaceuticals & Medicines | 0.6 | -11.4% |
| Communications Equipment | 0.6 | -1.8% |
| Medical Equipment & Supplies | 0.5 | 2.8% |
| Petroleum & Coal Products | 0.5 | 0.5% |
| Miscellaneous Manufactured Commodities | 0.4 | -5.7% |
| Commercial & Service Industry Machinery | 0.4 | 38.3% |
| Other General Purpose Machinery | 0.4 | 37.6% |
| Industrial Machinery | 0.3 | -21.9% |
| Used Or Second-hand Merchandise | 0.3 | 71.6% |
| Waste & Scrap | 0.3 | 1.0% |
| Motor Vehicle Parts | 0.3 | 65.7% |
| Other Fabricated Metal Products | 0.3 | 17.5% |
| Foods, Nesoi | 0.2 | 7.5% |
| Electrical Equipment | 0.2 | 23.7% |
| | |
Top 10 Export Markets, January 2025
| Country | December 2024 Exports ($b.) | Change from December 2023 |
|---|
| Mexico | $3.1 | 23.0% |
| Canada | 1.5 | 5.0% |
| Japan | 0.9 | 14.5% |
| China | 0.8 | -29.4% |
| Korea, South | 0.8 | 23.5% |
| Taiwan | 0.7 | -9.5% |
| Netherlands | 0.5 | 6.7% |
| Germany | 0.5 | -17.3% |
| United Kingdom | 0.5 | 60.5% |
| Hong Kong | 0.4 | -3.4% |
| | |