Below are highlights from the recently released trade data from the US Census Bureau and US Bureau of Economic Analysis. To view additional data and analysis related to the California economy, visit our website at www.centerforjobs.org/ca.
Trade activity through the state’s ports took a dip in January, with total export and import flows down 3.5% ($2.8 billion) from January 2025 and down 3.7% ($3.0 billion) from December. Export flows were up in both instances, while import flows fell substantially. State origin exports, however, were down 3.4% ($0.5 billion) from a year ago and down 7.6% ($1.2 billion) from the prior month.
Oil Imports
As in-state production has plummeted, California has become more reliant on crude oil imports—and as the state’s refineries close, final and blending product imports as well—to meet its energy needs. Energy Commission data shows the state relying on foreign sources for 61.1% of its crude oil use in 2025, surging from single digit results in the 1980s and 1990s.
California, consequently, is now facing more significant effects than the bulk of the largely self-sufficient US from the events in the Middle East. While down from prior years, California has relied on Middle East sources for generally 30-40% of its crude imports since 2021.
Despite sitting on top the 5th largest proven reserves in the US (2023), the current drop in traffic through the Strait of Hormuz now puts California in the same situation as regions such as the EU and China. The state now has to compete in bidding for replacement supplies from other sources but without the access those regions have to strategic petroleum reserves as a backup.

Exports by MSA
US Census Bureau has updated their origin export data by MSA. Los Angeles-Long Beach-Anaheim was again the 4th largest exporting urban area in 2025. Of the California MSAs included in the data, exports fell by nominal value in the San Diego area, were essentially unchanged in the Inland Empire, and grew in the other urban regions. The Bay Area saw a small increase in its total share of US exports.

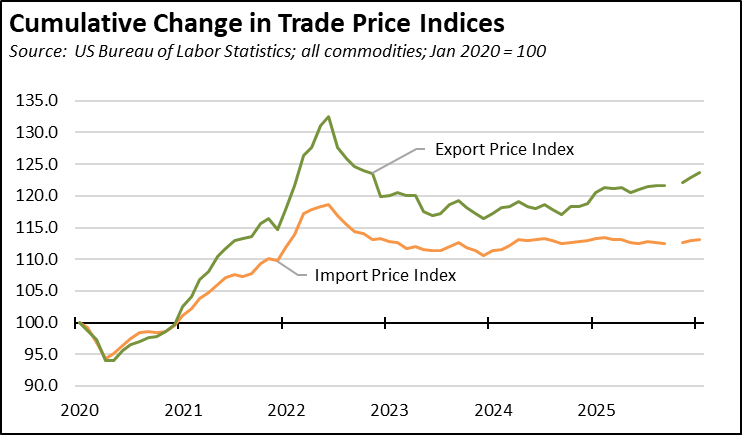
Prices
While import prices previously held steady rather than dropping to accommodate tariff increases, both December and January saw increases over the year for the less volatile imports excluding fuels index. Export prices continued to climb at essentially the same pace over the past 5 months. Export prices continued to climb but at a somewhat lower pace in January.


California Goods Exports
in Exports
Total California origin goods exports were down $0.5 billion from January 2025 (down 3.4%). California remained in 2nd place with 8.54% of all US goods exports (12 month moving total), behind Texas at 20.52%.
California Goods Imports
in Imports
Total California destination goods imports dropped $3.9 billion from January 2025 (down 9.1%).
Top 20 Exports, January 2026
Top 20 exports by value are shown below, along with the change from Jan 2025.