Below are highlights from the recently released trade data from the US Census Bureau and US Bureau of Economic Analysis. To view additional data and analysis related to the California economy visit our website at www.centerforjobs.org/ca.
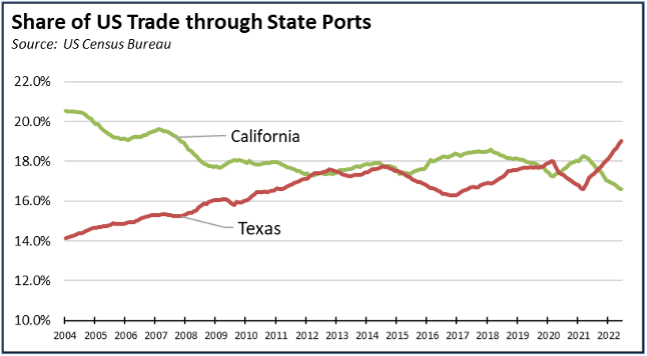
The June data in general saw little change in California exports in real terms, with the numbers down slightly from a year ago but essentially level from pre-pandemic June 2019. Imports continued to exhibit strong growth in both nominal and real terms, in part by the continuing drive by importers to get ahead of potential West Coast port labor actions and other looming trade disruptions. California’s relative position in terms of total trade through the state’s ports and origin exports continued to weaken both in response to these challenges and given the long-term trend, the declining competitiveness of the state as a trade conduit due to rising costs, lag in infrastructure and warehousing capacity, and increasing regulations on critical trade related operations.
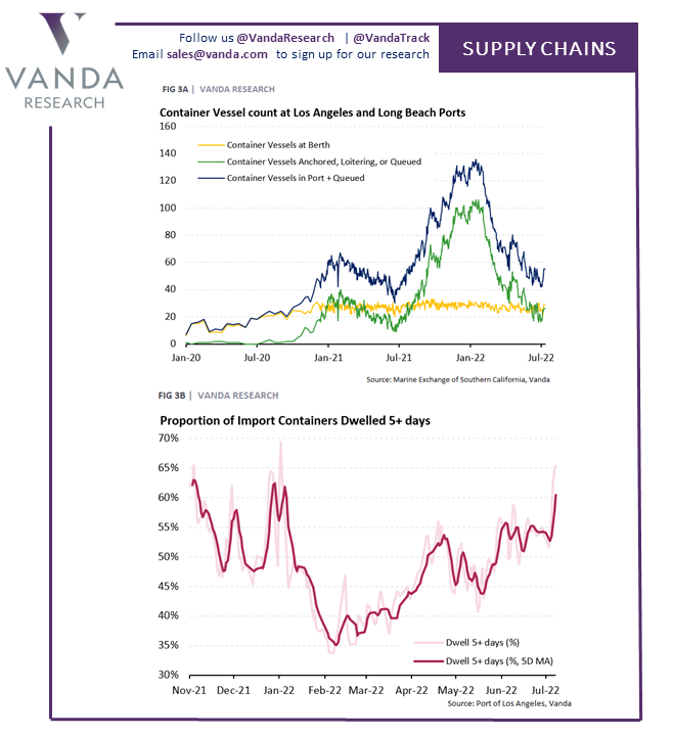
As indicated in the following charts from Vanda Research, congestion off the San Pedro Bay ports is showing improvement as the number of ships at anchor, loitering, or slow steaming are down from their previous highs, although this still remains a factor in the broader sources of continuing supply disruptions. Congestion, however, continues to move inland as containers remain within or near the ports for lengthier periods as the results of shortages in drivers and warehousing space.
Rather than working to help relieve this component of the supply chain disruptions contributing to shortages and inflation, the state Department of Justice continues to wage a litigation strategy against new warehouse expansions and the blue collar, middle class wages they provide. In spite of a growing truck driver shortage, state regulations are now in the process of shutting down a core component of the overall supply, the independent owner-operators that comprise a quarter of the total number of truck drivers currently working in the state.
Under the AB 5 (2019) regulations, these truck drivers will no longer be able to work as self-employed operators but instead will be able to work in the state only if they become a wage and salary employee of a larger company. As shown in their recent demonstrations at ports in Los Angeles and Oakland, at least a sizeable component of these workers prefer to continue working as their own boss, retaining the work flexibility they now have while also beginning a small business that as it grows provides a source of income mobility and family wealth creation. Independent operators who want to continue operating as their own business instead are leaving the state or being told by their customers they need to leave the state if they want to continue as a small business owner.
One of the positive trends to come out of the pandemic period was the rapid shift to telecommuting, that preserved jobs and household incomes for a sizeable portion of the state. As Covid continues to ease, a large share of these workers show strong preference for maintaining this work arrangement in no small part because of the flexibility and opportunities for work-life balance it provides. As detailed in the Center’s report on this trend, the state’s labor laws largely restricted this option to what Joel Kotkin terms the “laptop class,” the professionals, lawyers, tech workers, and other higher income white collar workers. A much broader range of wage levels are capable of doing their work by telecommuting or other flexible work arrangements, but state labor law restrictions unique to California limit this option only to the higher wage components. AB 5 in the case of independent operators adds a new layer of such restrictions, forcing 72,200 truck drivers to decide whether they must leave the state. While state policies continue to profess concern over economic inequality, state regulations continue to favor the laptop class while increasing costs and diminishing opportunities for the lunch bucket class of workers.
The declining competitiveness of the state is also shown in the recent rankings by the World Bank of comparative global port performance. As measured by two different analytical approaches to determine the number of port hours per ship call, Los Angeles and Long Beach ranked at the bottom of 370 ports assessed worldwide. Port of Oakland fell within the bottom 12. The other California port, Port Hueneme, did better but still ranked in the bottom third at 269 (administrative approach) and 274 (statistical approach).
As shown from these rankings, congestion both from delayed ships and lack of sufficient infrastructure and workers further on in the supply chain remains a pressing problem for California and for this critical blue collar, middle-class wage sector. And it remains at levels that is causing key players to bypass the state, as indicated in the recent decision by BNSF railroad to extend their embargo of many westbound shipments to California as the only option they have to deal with the increasing congestion issues.
California Goods Exports
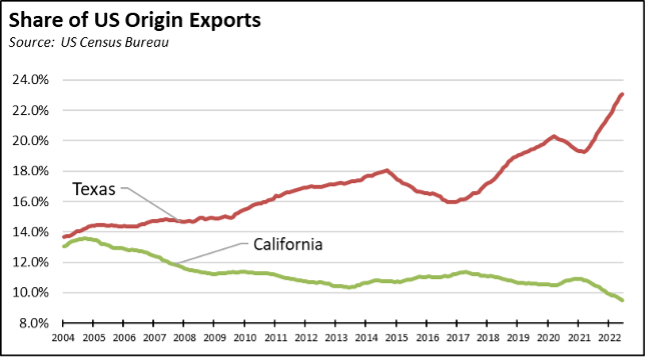
Total California goods exports were up $1.2 billion from June 2021 (up 7.7%) in nominal terms, but showed a slight decline in real terms. California remained in 2nd place with 9.48% of all US goods exports (12 month moving total), behind Texas at 23.09%.
Compared to pre-pandemic June 2019, origin goods exports were up $2.2 billion in nominal terms (15.6%), but essentially were unchanged in real terms.
California Goods Imports
Total California destination goods imports were up $6.1 billion from June 2021 (up 15.2%). Compared to pre-pandemic June 2019, imports were up $10.6 billion (30.1%), showing a sustained rise in both nominal and real terms.
Note that both origin exports and destination imports incorporate goods produced/used within the state and those that are assembled by state businesses for shipment elsewhere. Because the Center’s focus is on California jobs rather than macroeconomic forecasting, these indicators are presented as reported to reflect changes in the associated jobs base.
Top 20 Exports, June 2022
Top 20 exports by value are shown below, along with the change from June 2021.