Below are highlights from the recently released trade data from the US Census Bureau and US Bureau of Economic Analysis. To view additional data and analysis related to the California economy visit our website at www.centerforjobs.org/ca.
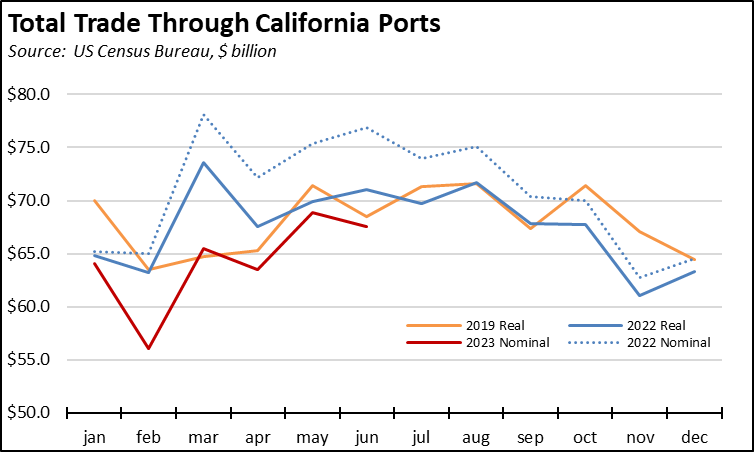
The June trade numbers for California continued to show lower activity. Total trade through the state’s ports was down 12.1% from June 2022 in nominal terms, while origin exports were off 4.8% and destination imports dropped 18.6%.
Year to date, overall trade activity has trended lower. Considered in real terms, trade through the state’s ports in the first six months has remained below pre-pandemic 2019 in all but March. Due to the current deflationary trend in both export and import prices, the gap narrows somewhat when comparing the 2022 data in constant dollars, but a clear decline is evident due to prolonged uncertainty stemming from the labor situation combined with increasing costs from state and regional regulations.
Share of Goods through US Ports
15.4%
CA Share Of Total Trade
Through US Ports
The share of total US goods trade (exports and imports) through California ports continued dropping to 15.43% (12 month moving average; compared to 15.48% in May 2023 and 16.58% in June 2022).
California remained the #2 state, behind Texas with 20.10% (compared to 20.10% in May 2023 and 19.05% in June 2022). Trade through the Atlantic port states was at 29.92% (compared to 29.84% in May 2023 and 29.71% in June 2022).
While continuing to fall behind Texas, the state’s position in this area forms the trade-related base for one of California’s largest centers of middle-class, blue-collar jobs. Transportation & Warehousing alone provided 792,700 in June 2023, up from 770,300 in June 2022.
California Goods Exports
-$0.8
Billion Change In Exports
Total California goods exports were down $0.8 billion from June 2022 (down 4.8%). California remained in 2nd place with 8.84% of all US goods exports (12 month moving total), behind Texas at 22.53%.
California Goods Imports
-$8.5
Billion Change In Imports
Total California destination goods imports dropped $8.5 billion from June 2022 (down 18.6%).
Top 20 Exports, June 2023
Top 20 exports by value are shown below, along with the change from Jun 2022.
| NAICS Commodity |
Jun 2023 Exports ($b.) |
Change from Jun 2022 |
| Miscellaneous Manufactured Commodities |
$1.1 |
7.3% |
| Semiconductors & Other Electronic Components |
1.0 |
-10.2% |
| Navigational/measuring/medical/control Instrument |
0.9 |
0.0% |
| Fruits & Tree Nuts |
0.8 |
-16.2% |
| Aerospace Products & Parts |
0.8 |
26.1% |
| Computer Equipment |
0.7 |
-5.3% |
| Communications Equipment |
0.6 |
21.6% |
| Industrial Machinery |
0.6 |
-33.5% |
| Pharmaceuticals & Medicines |
0.6 |
-20.1% |
| Medical Equipment & Supplies |
0.6 |
6.8% |
| Petroleum & Coal Products |
0.5 |
9.0% |
| Electrical Equipment & Components, Nesoi |
0.4 |
3.5% |
| Waste & Scrap |
0.4 |
-8.7% |
| Commercial & Service Industry Machinery |
0.3 |
27.9% |
| Other General Purpose Machinery |
0.3 |
5.6% |
| Motor Vehicle Parts |
0.3 |
19.7% |
| Basic Chemicals |
0.3 |
-30.3% |
| Used Or Second-hand Merchandise |
0.3 |
5.7% |
| Other Fabricated Metal Products |
0.3 |
6.4% |
| Plastics Products |
0.3 |
-1.9% |
|
|
|
Top 10 Export Markets, June 2023
| Country |
Jun 2023 Exports ($b.) |
Change from Jun 2022 |
| Mexico |
$2.9 |
11.5% |
| Canada |
1.7 |
-15.4% |
| China |
1.4 |
-12.4% |
| Japan |
0.9 |
-10.2% |
| Korea, South |
0.9 |
-1.7% |
| Hong Kong |
0.7 |
27.7% |
| Taiwan |
0.7 |
-22.5% |
| Netherlands |
0.5 |
-11.5% |
| India |
0.5 |
1.8% |
| Germany |
0.5 |
-5.2% |
|
|
|