04/27/2024

Reports » Trade Reports

California Trade Report for March 2019

Below are highlights from the recently released trade data from the US Census Bureau and US Bureau of Economic Analysis. To view additional data and analysis related to the California economy visit our website at www.centerforjobs.org/ca.

Share of Goods through US Ports

18.1%
CA Share of Total Trade Through US Ports

Total US goods trade (exports and imports) through California ports were down marginally to 18.09% (12 month moving average; compared to 18.10% in Feb 2019 and 18.47% in Mar 2018).

California remained the #1 state, ahead of Texas with 17.69% (compared to 17.66% in Feb 2019 and 16.92% in Mar 2018). Trade through the Atlantic port states was at 29.48% (compared to 29.4% in Feb 2019 and 29.4% in Mar 2018). Total trade through the state’s ports, however, was down 1.3% compared to Mar 2018, the third month in the last twelve showing a year-over-year decline.
The state’s continued lead in this area forms the trade-related base for one of California’s largest centers of middle-class, blue-collar jobs. Transportation & Warehousing alone provided 605,500 jobs in Mar (up from 589,900 in Mar 2018), paying an average annual salary of $62.9k. This employment base in turn supports additional blue-collar and white-collar jobs in a range of other industries.

California Goods Exports Decrease

-$0.4
Billion in Exports

Total California goods exports were down $0.4 billion from Mar 2018 (down 2.6%), the fourth month in the last twelve showing a year-over-year decline. California remained in 2nd place with 10.65% of all US goods exports (12 month moving total), behind Texas at 19.24%.

California's Balance for Goods Trade

-$15.6
Billion of Goods Trade

California’s balance of goods trade through state businesses narrowed to -$15.6 billion, compared to a level of -$18.1 billion in Mar 2018. California trade accounted for 26% of the US trade deficit in goods in Mar 2019.

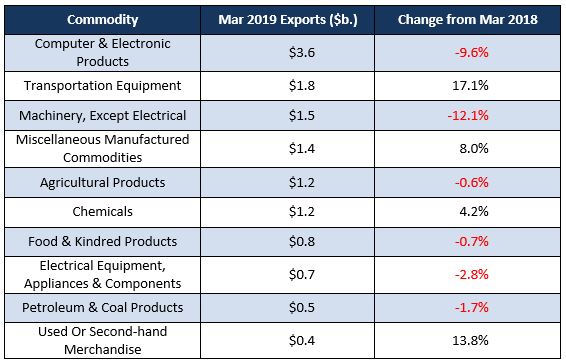
Top 10 Exports, March 2019

Top 10 exports by value are shown below, along with the change from Mar 2018.

By shipping weight (vessel and air total), the leading export was Petroleum & Coal Products at 1.3 billion kg (36% of total exports), followed by Waste & Scrap at 1.0 billion kg (27%), and Agricultural Products at 0.4 billion kg (12%).

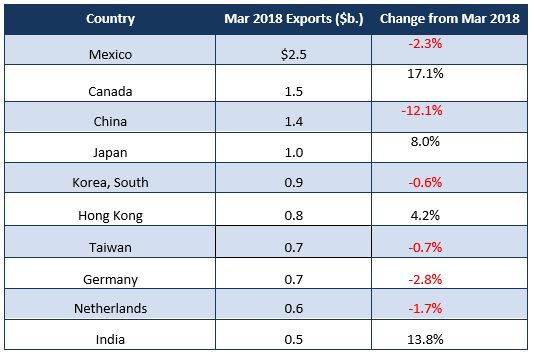
Top 10 Export Markets, March 2019