Below are highlights from the recently released trade data from the US Census Bureau and US Bureau of Economic Analysis. To view additional data and analysis related to the California economy visit our website at www.centerforjobs.org/ca.
While partial progress appears to have been made finally in the extended West Coast port labor talks, the uncertainty rising over these negotiations combined with growing concerns over a potential recession have seen a growing shift of trade traffic to the other coasts. The overall trade numbers for California were down for the year in the latest data for March.
Share of Goods through US Ports
Through US Ports
The share of total US goods trade (exports and imports) through California ports continued dropping to 15.57% (12 month moving average; compared to 15.72% in February 2023 and 16.89% in March 2022).
California remained the #2 state, behind Texas with 20.07% (compared to 19.92% in February 2023 and 18.49% in March 2022). Trade through the Atlantic port states was at 29.72% (compared to 29.74% in February 2023 and 29.9% in March 2022).
While California continues to lose ground from its previous dominant position, the state remains the second biggest center of trade activity which in turn supports one of California’s largest centers of middle-class, blue-collar jobs. Transportation & Warehousing alone provided 794,000 wage and salary jobs in the most recent data from March 2023. Support and supply industries increased the jobs total further.
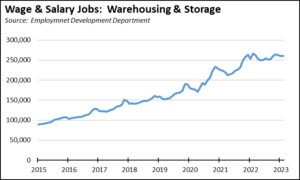
The Warehousing & Storage component of this industry alone currently employs about 260,000 wage and salary workers, with the 2023 average to date up 57% from the pre-pandemic average in 2019. With an annual average wage of $58,500 (3rd quarter 2022), this segment and the broader trade-related industries provided the only substantial alternative to blue collar workers as the state-ordered job closures heavily impacted this class of workers the most. The job levels in warehousing, however, have leveled out as the costs of operating continue to increase in California and as warehousing development has moved to neighboring states. This trend is also likely to intensify from the current movement of trade activity to the other coasts.
California Goods Exports
Total California goods exports were down $0.7 billion from March 2022 (down 4.3%) in nominal terms. In real terms, exports compared to pre-pandemic March 2019 were not substantially changed, down 6.2%.
California remained in 2nd place with 8.83% of all US goods exports (12 month moving total), behind Texas at 23.14%.
California Goods Imports
Reflecting a number of factors—including continuing uncertainty over the West Coast port labor talks and uncertainty over a potential downturn later this year—total California destination goods imports were down sharply by $9.7 billion from March 2023 (down 20.5%) in nominal terms. In real terms, however, imports were up 9.7% compared to pre-pandemic March 2019.
Top 20 Exports, March 2023
Top 20 exports by value are shown below, along with the change from March 2022.