Download Report Below are highlights from the recently released trade data from the US Census Bureau and US Bureau of Economic Analysis. To view additional data and analysis related to the California economy visit our website at www.centerforjobs.org/ca.
Total trade through the state’s ports was up $2.2 billion (3.3%) in March compared to the same period a year ago, generating yet another rise (on a 12-month moving basis) in the state’s overall share of US trade to 15.75% compared to the low of 15.32% last August. The share of total trade flows handled by California ports and businesses, however, remains well below the series peak of 20.55% reached in January 2004.
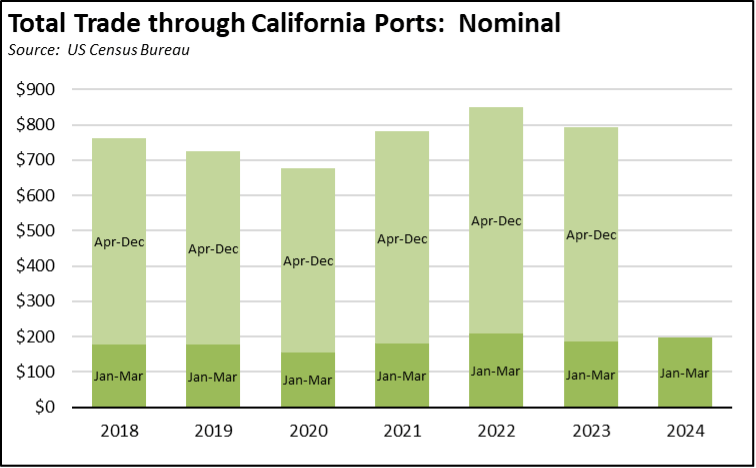
On a nominal basis, total trade through the California ports in the first quarter was 7.1% higher than the total for the same period in 2023 and 12.8% higher than in pre-pandemic 2019.
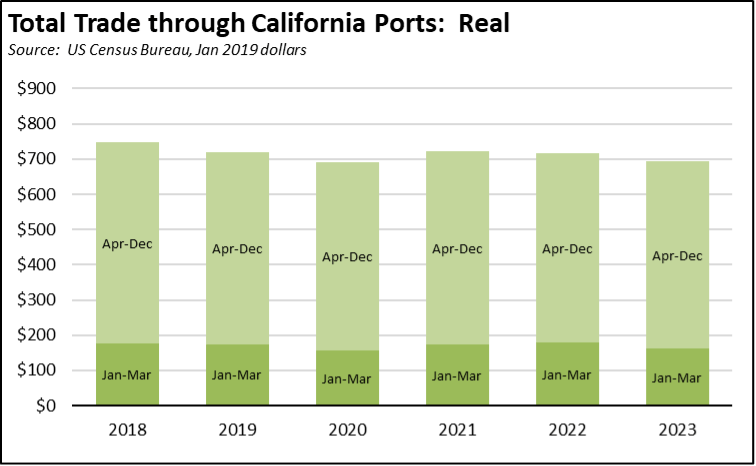
In real terms (January 2019 dollars), trade flows were still above the prior year but essentially unchanged from first quarter 2019, indicating at least from this metric that trade flows have reached a recovery level.
Trade volumes associated with in-state production and final goods demand, however, were both down. State origin exports were down 5.3% from March 2023, and destination imports were off 2.4%.
Share of Goods through US Ports
15.7%
CA Share of Total Trade
Through US Ports
The share of total US goods trade (exports and imports by value) through California ports edged up to 15.75% (12 month moving average; compared to 15.61% in February 2024 and 15.57% in March 2023).
California remained the #2 state, behind Texas with 20.03% (compared to 20.08% in February 2024 and 20.08% in March 2023). Trade through the Atlantic port states was at 29.99% (compared to 29.96% in February 2024 and 29.73% in March 2023). The state’s continued ranking in this area forms the trade-related base for one of California’s largest centers of middle-class, blue-collar jobs. Transportation & Warehousing alone provided 753,300 wage and salary jobs in March 2024, down from 757,500 in March 2023.
California Goods Exports
-$0.9
Billion Change in Exports
Total California goods exports were down $0.9 billion from March 2023 (down 5.3%). California remained in 2nd place with 8.78% of all US goods exports (12 month moving total), behind Texas at 22.06%.
California Goods Imports
-$0.9
Billion Change in Imports
Total California destination goods imports dropped $0.9 billion from March 2023 (down 2.4%).
Top 20 Exports, February 2024
Top 20 exports by value are shown below, along with the change from Mar 2023.
| NAICS Commodity | Mar 2024 Exports ($b.) | Change from Mar 2023 |
|---|
| Computer Equipment | $1.4 | 76.9% |
| Fruits & Tree Nuts | 1.0 | 9.5% |
| Navigational/measuring/medical/control Instrument | 0.9 | -6.7% |
| Semiconductors & Other Electronic Components | 0.8 | -2.8% |
| Pharmaceuticals & Medicines | 0.8 | -2.3% |
| Communications Equipment | 0.7 | -2.0% |
| Aerospace Products & Parts | 0.7 | -16.8% |
| Medical Equipment & Supplies | 0.6 | 0.4% |
| Electrical Equipment & Components, Nesoi | 0.5 | 9.1% |
| Industrial Machinery | 0.5 | -24.1% |
| Petroleum & Coal Products | 0.4 | -22.7% |
| Miscellaneous Manufactured Commodities | 0.4 | -55.7% |
| Waste & Scrap | 0.4 | -13.5% |
| Commercial & Service Industry Machinery | 0.4 | -0.6% |
| Other General Purpose Machinery | 0.3 | 1.0% |
| Used Or Second-hand Merchandise | 0.3 | -11.9% |
| Other Fabricated Metal Products | 0.3 | 0.0% |
| Foods, Nesoi | 0.2 | 7.6% |
| Plastics Products | 0.2 | -15.5% |
| Dairy Products | 0.2 | -7.0% |
| | |
Top 10 Export Markets, February 2024
| Country | Feb 2024 Exports ($b.) | Change from Feb 2023 |
|---|
| Mexico | $2.6 | -9.7% |
| Canada | 1.6 | -1.1% |
| China | 1.3 | -14.5% |
| Japan | 0.9 | -1.3% |
| Korea, South | 0.8 | -9.7% |
| Taiwan | 0.8 | -30.75 |
| Netherlands | 0.7 | 14.45 |
| Germany | 0.6 | 7.3% |
| Hong Kong | 0.5 | 16.4% |
| United Kingdom | 0.4 | 5.5% |
| | |