Below are highlights from the recently released trade data from the US Census Bureau and US Bureau of Economic Analysis. To view additional data and analysis related to the California economy visit our website at www.centerforjobs.org/ca.
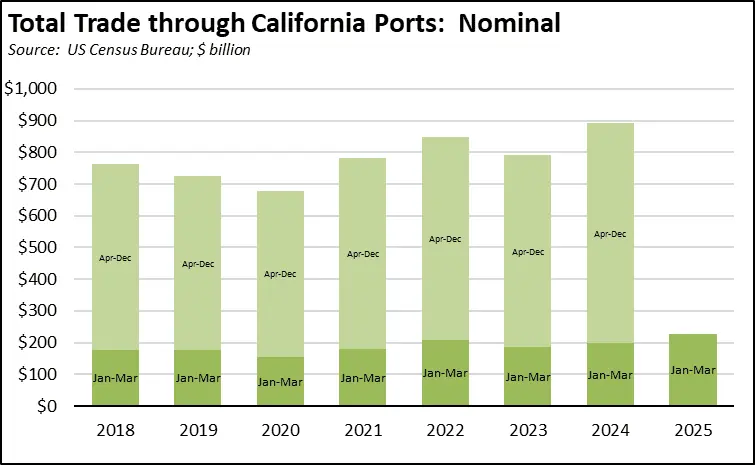
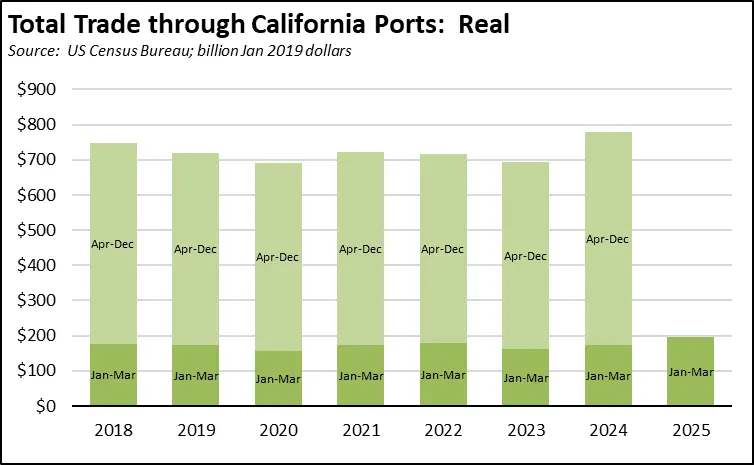
Trade through California ports and US trade in general again surged in March as shippers moved goods ahead of tariffs. In nominal terms, trade through the state’s ports in the first quarter was up 14.7% compared to the same period in 2024. In real terms, goods traffic rose 12.8%. Looking at the state economy results, origin exports rose $2.2 billion (7.7%) in March compared to March 2024, while destination imports were up by $3.8 billion (10.5%).
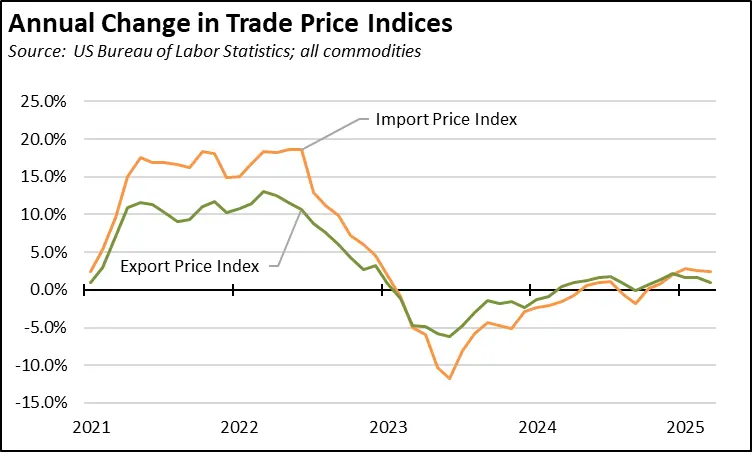
Goods prices, however, have yet to show much change. Nationally, import prices were essentially level, while export prices showed a marginal dip.
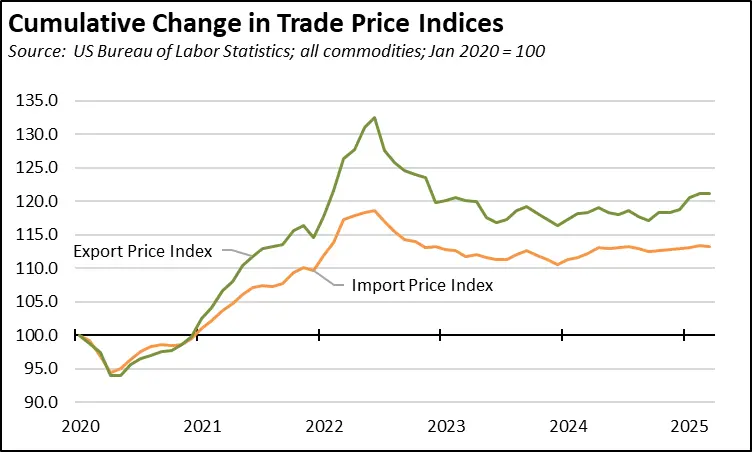
After rising rapidly during the beginning of the pandemic period, import prices have remained within a relatively stable but elevated band beginning in mid-2022. Export prices, in contrast, have been on a generally upward trend since late 2024.
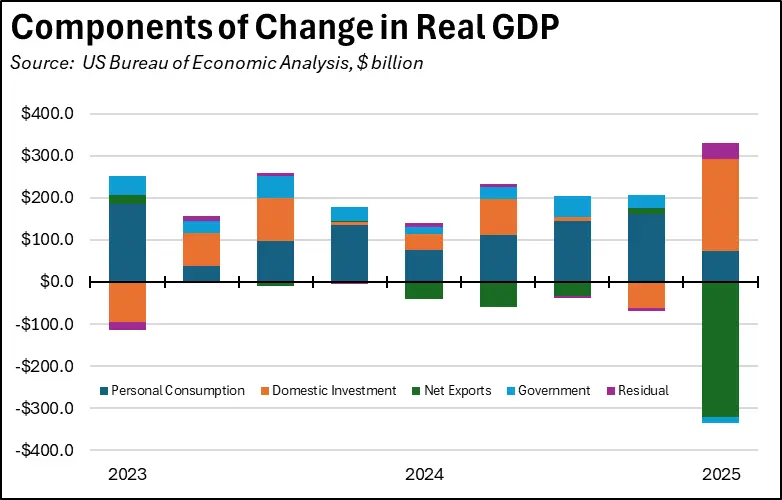
Nationally, the surge in imports ahead of tariffs pushed the US deficit to its highest level ever of $140.5 billion in March. The significance of this number can be illustrated through the effect on the GDP results in the first estimate for 2025:Q1. As indicated in the chart, the other GDP components reported fairly strong results (although Investment is also affected by an associated runup in inventories by $140 billion), coming in at the highest since the pandemic recovery in 2021:Q4. The 0.3% dip in Real GDP came solely from the effect of accelerated imports in advance of tariffs.
The question with tariffs then remains, what’s next? After the shipping surge, indications for April and at least in the near term are that trade volumes will drop substantially. According to Vizion, total US export bookings (in TEUs) in April were up 9% due to a last-minute surge in the final week, although shipping to California’s key China market was off 74%. Imports had more slowing, with Vizion showing all import bookings down 12% compared to April 2024, and China import bookings down 38% as sourcing continues to move to other countries. Indications from Port of Los Angeles Director Gene Seroka are that import bookings for the second week of May are off 35% compared to the same week in 2024.
After initially rejecting them outright, China has since agreed to trade talks, putting an agreement at least in the realm of possibility if not yet probability, likely as the result of growing unrest over manufacturing closures and pay issues as well as economic weakness that has led to increasing decisions to cease publication of the offending data.
For California businesses, the affected universe can be represented by the Top 5 markets for origin exports, which together accounted for 58% of all state imports in 2024. As indicated, the leading products sold into these markets come from a range of the state’s high tech and basic manufacturing and agriculture industries, but with China still remaining a key end point to ease the pressure of economic realities off California’s recycling stream. On the flip side, World Integrated Trade Solution data indicates that 60.2% of imports (goods and services) nationally in 2022 was for intermediate inputs, capital goods, and raw materials rather than for consumer goods.
California Goods Exports
in Exports
Total California origin goods exports rose $1.2 billion from March 2024 (up 7.7%). California remained in 2nd place with 8.97% of all US goods exports (12 month moving total), behind Texas at 21.99%.
California Goods Imports
in Imports
Total California destination goods imports grew $3.8 billion from March 2024 (up 10.5%).
Top 20 Exports, March 2025
Top 20 exports by value are shown below, along with the change from Mar 2024.