Below are highlights from the recently released trade data from the US Census Bureau and US Bureau of Economic Analysis.
The May data in general saw California exports continuing recovery in nominal terms, but when viewed in real dollars, exports were essentially level when compared to the prior year and remained substantially below the pre-pandemic level in 2019. Imports, however, continued to surge both in nominal and real terms. Total trade activity through the state’s ports—while continuing to lose ground to #1 Texas in relative terms—was up more strongly likely in response to shipper efforts to get ahead of potential transportation strikes this summer.
Talks with West Coast dockworkers continue without conclusion, although work also continues even after the previous contract expired. Potential labor actions by 12 unions with far broader effects on rail activity moved into the next stage, with the process now turning to a 30-day cooling off period. Combined with potential administrative actions at the end of that period, without resolution, rail shutdowns could begin just prior to the November elections.
In the latest results for July 1, a total of 18 container ships were in the backup off the San Pedro Bay ports, including one anchored and 17 slow speed steaming or loitering outside the 25-mile Safety and Air Quality Area. At least a portion of this relief, however, comes as shippers have begun diverting to other ports due to the risk of a ports strike. While this congestion is down considerably offshore, the effects have spread inland as shipments are now backing up due to rail congestion both within Southern California and as containers accumulate at core hubs such as Chicago, lack of warehouse space within Southern California—now operating with a vacancy rate of only 0.3%—and as soaring diesel prices affect trucking operations.
Globally, similar issues are adding to the supply chain disruptions, affecting both destination markets and critical component supplies. In addition to the more broadly covered pandemic problems in China, strikes have already slowed goods movement in South Korea and the EU. The same issues producing massive delays in air travel within the US could also spread quickly to air freight, an alternative that would become in even higher demand in the event of a ports or rail strike.
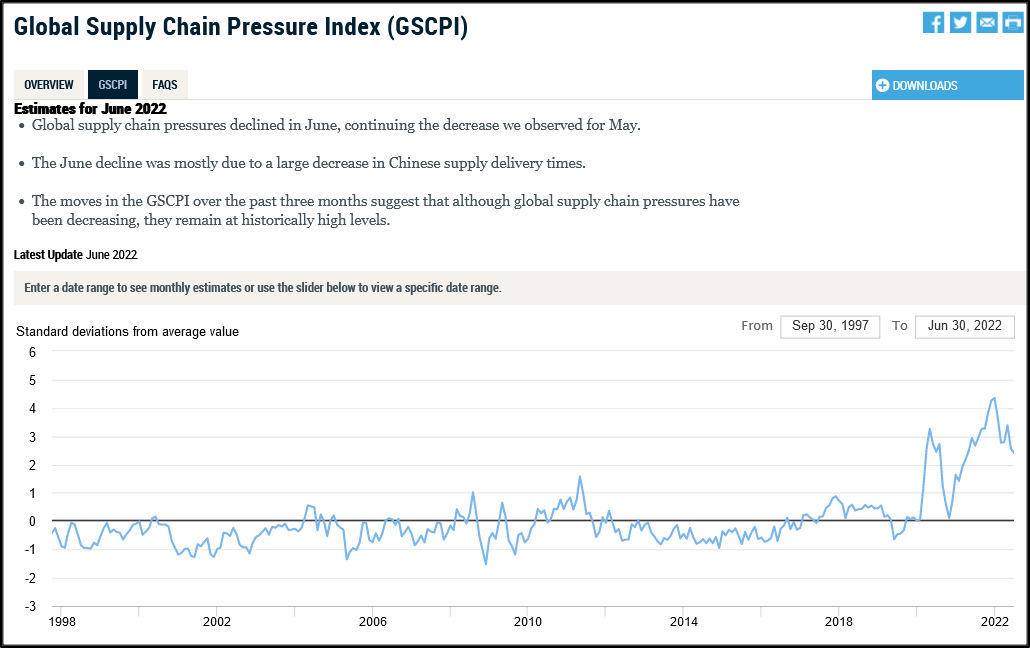
As measured by the New York Federal Reserve Global Supply Chain Pressure Index, supply congestion has eased in recent months, but the overall level remains at substantially elevated levels. Some progress has been made, but nowhere near enough.
California Goods Exports
Total California origin goods exports were up $1.2 billion from May 2021 (up 8.3%). California remained in 2nd place as its position continued to erode to 9.60% of all US goods exports (12-month moving total), behind Texas at 22.91%.
Compared to pre-pandemic May 2019, origin goods exports were up only $0.7 billion in nominal terms (4.8%). While exports have continued to show recovery, in real terms they remain substantially depressed.
California Goods Imports
Total California destination goods imports were up $5.2 billion from May 2021 (up 13.3%). Compared to pre-pandemic May 2019, imports were up $8.0 billion (22.3%), indicating a strong rise in both nominal and real terms. While a component of the increase is coming from the current import drive to get ahead of a potential West Coast port strike, the sustained rise in imports also is a reflection of the outcomes from the state’s climate change policies, reducing emissions within the state but shifting the associated production and emissions elsewhere to be imported into California below the regulatory accounting process.
Note that both origin exports and destination imports incorporate goods produced/used within the state and those that are assembled by state businesses for shipment elsewhere. Because the Center’s focus is on California jobs rather than macroeconomic forecasting, these indicators are presented as reported to reflect changes in the associated jobs base.
Top 20 Exports, May 2022
Top 20 exports by value are shown below, along with the change from May 2021.