
Below are highlights from the recently released trade data from the US Census Bureau and US Bureau of Economic Analysis. To view additional data and analysis related to the California economy visit our website at www.centerforjobs.org/ca. Data Note: During the update to our data series due to the annual revisions, the port import flow numbers were incorrect. The data has now been revised to show the correct numbers. Rather than 16.92% of the nation’s total trade flows as we reported, California’s ports handled 16.53% in April (12-month moving average).
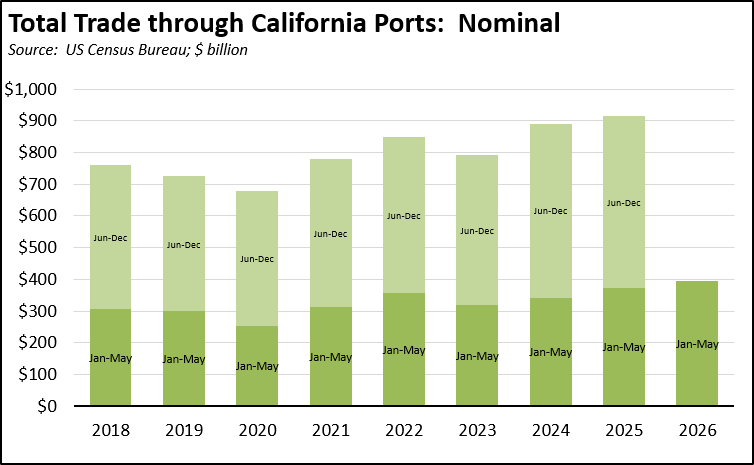
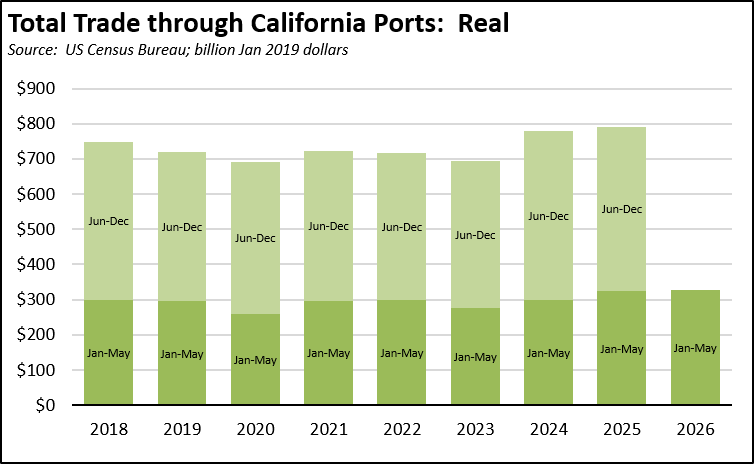
In May, total trade through the state’s ports remained high compared to the same month in 2025 (+12.9%) but was only slightly changed from April 2026 (-1.1%). Overall, total trade through the ports in the first 5 months was higher in nominal terms, but little changed in real terms.
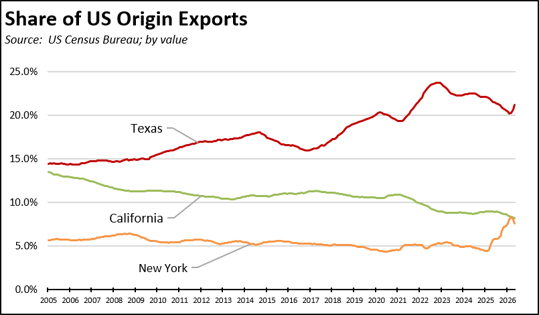
In nominal terms, state origin exports were up $0.6 billion (3.5%) for the month and only $0.2 billion (1.4%) for the year. On a 12-month moving average basis, California’s share of total US origin exports at 8.23% in May is down substantially from its recent high of 9.00% in February 2025. The state, in fact, is now at risk of falling into 3rd place due to this trend combined with rising exports from New York.
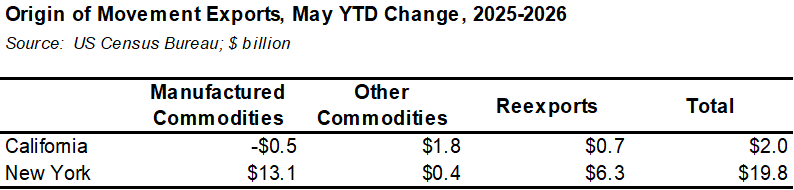
The surge from New York is due to a large increase in manufactured goods, which rose $13.1 billion in the year-to-date numbers compared to California which were largely unchanged with a dip of $0.5 billion.
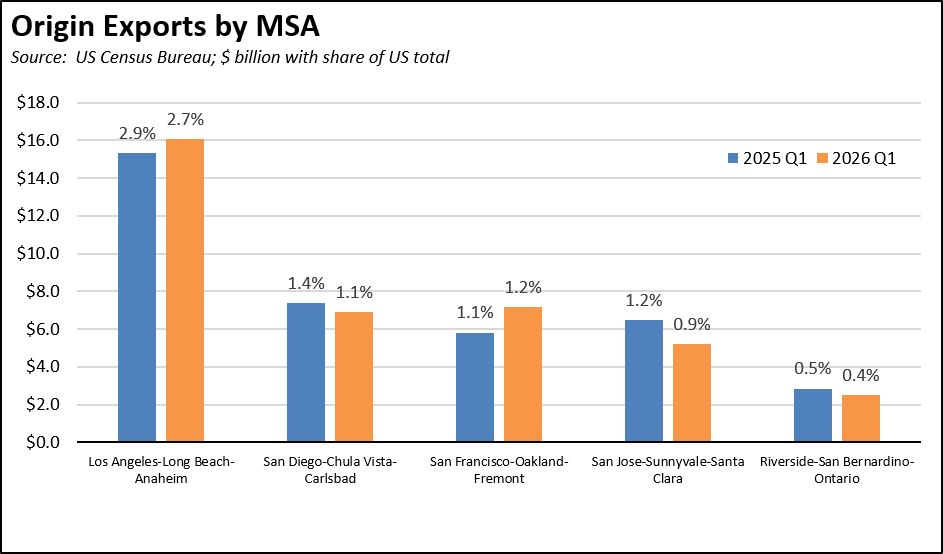
In 2026:Q1, exports from the state’s 5 largest MSAs were largely unchanged in nominal terms from the same quarter in the prior year at $37.8 billion vs. $37.9 billion, but their combined share of total US exports dropped to 6.3% from 7.2%.
Destination imports were up sharply over the year at $7.3 billion (19.2%). Much of this traffic, however, is bringing trade flows forward from later in the year as holiday goods shipments are being made early to get ahead of tariffs, disruptions from the Gulf actions, and the resulting rise in shipping rates.
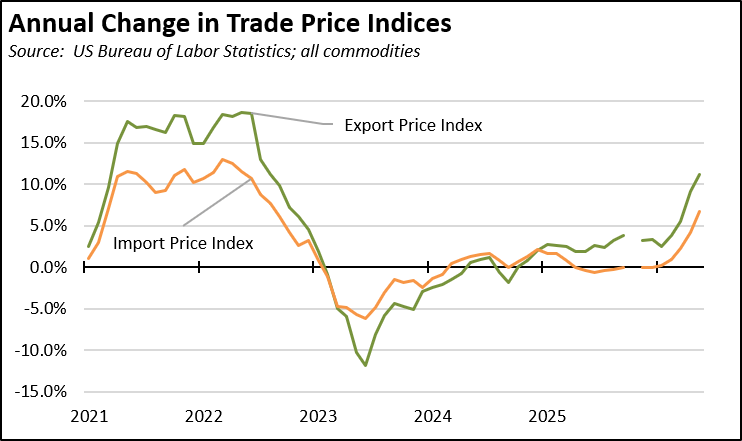
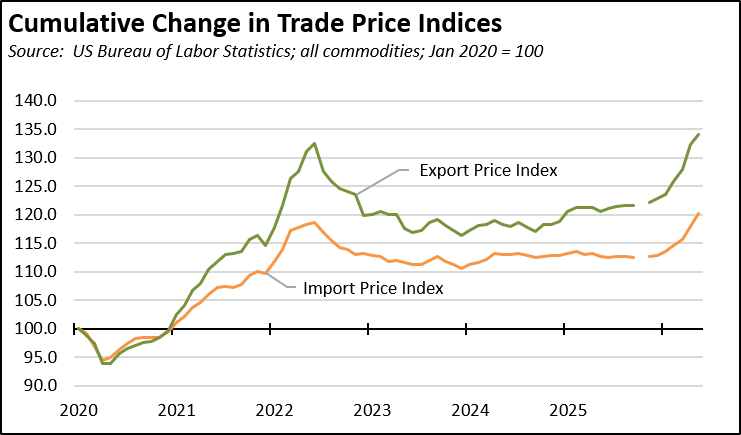
These costs are reflected in rising trade prices. Import prices (all goods) were up 25.3% on an annualized basis for the month and 6.7% for the year. Export prices (all goods) were up 16.2% on an annualized basis and 11.2% for the year.
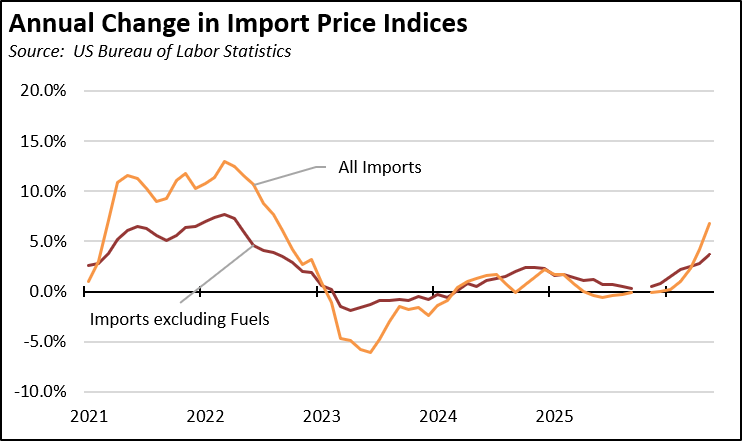
While much of the rise is due to oil prices, import prices for all goods other than the more volatile energy category were up 10.3% on an annualized basis for the month, but lower (although still substantial) at 3.7% for the year.
California Goods Exports
Total California origin goods exports were up $0.2 billion from May 2025 (up 1.4%). California remained in 2nd place with 8.23% of all US goods exports (12 month moving total), behind Texas at 21.15%.
California Goods Imports
Total California destination goods imports surged by $7.3 billion from May 2025 (up 19.2%).
Top 20 Exports, May 2026
Top 20 exports by value are shown below, along with the change from May 2025.