Below are highlights from the recently released trade data from the US Census Bureau and US Bureau of Economic Analysis.
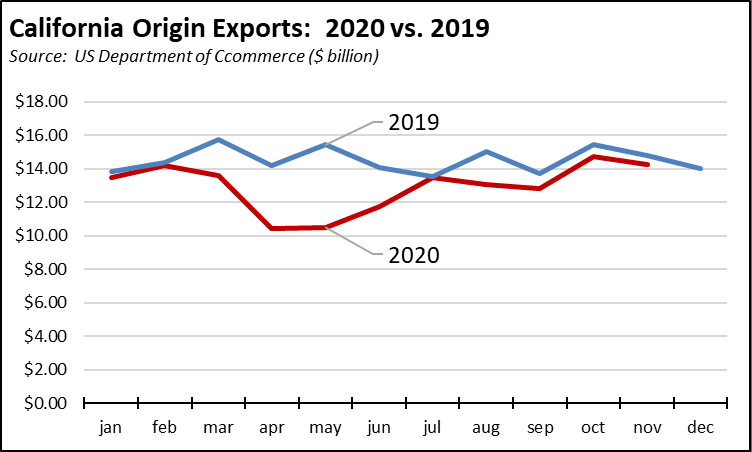
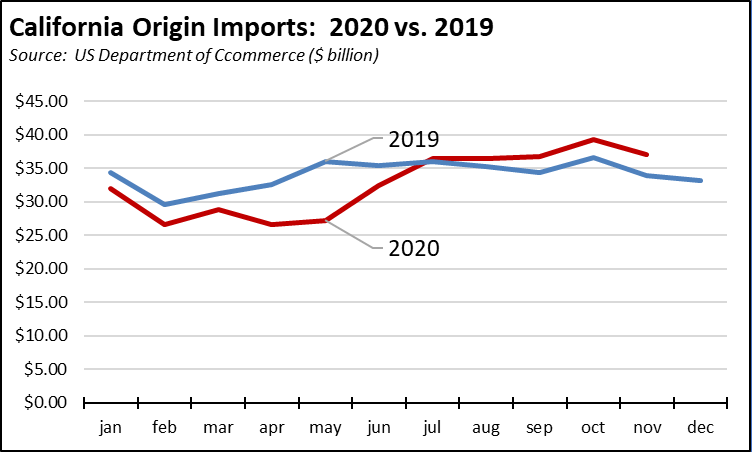
California origin exports—including both products produced in the state and products aggregated by exporting firms—remained below the 2019 levels. Origin imports—both products used in the state and aggregated by state-based importers for subsequent distribution to other states—remained well above the 2019 numbers.
Goods activity through the state’s ports also remained high. Goods exports through the ports were only off 4%, while goods coming in through the ports were up 8%.
The state also has maintained its share of the China trade in spite of economic challenges coming from the Panama Canal widening and shifts in traffic patterns to the Gulf and Atlantic ports. Comparing total movement through the state’s ports January through November in 2019 and 2020, California ports had a 30.8% share of goods export traffic to China (China, Hong Kong, and Macau) in 2019, and 30.0% in for the period in 2020. For the far larger import traffic, California ports had a 43.2% share in 2019, and 42.9% in 2020. California’s geographic advantages continue to maintain the base for these important higher-wage blue collar jobs. These advantages, however, also continue to be under threat from rising costs due to traffic congestion in Southern California even as state transportation and cap-and-trade funding prioritizes projects such public transit that saw plunging ridership even prior to the current crisis and High Speed Rail that has few tangible promises for either traffic or climate change emissions benefits. The growing body of state regulations also continue to impose substantial new compliance costs even during an unprecedented economic crisis that sees other states trying to restore and expand jobs rather than adding to the barriers to recovery.
California Goods Exports Decrease
Total California goods exports were down $0.5 billion from Nov 2019 (down 3.6%). California remained in 2nd place with 10.88% of all US goods exports (12 month moving total), behind Texas at 19.67%.
California's Balance for Goods Trade
California’s balance of goods trade activity through state businesses broadened to -$22.8 billion, compared to a level of -$19.2 billion in Nov 2019. California trade accounted for 27% of the US trade deficit in goods in Nov 2020.
Top 20 Exports, November 2020
Top 20 exports by value are shown below, along with the change from November 2019.
By shipping weight (vessel and air total), the leading export was Waste & Scrap at 0.9 billion kg (30% of total exports), followed by Petroleum & Coal Products at 0.7 billion kg (22%), and Fruits & Tree Nuts at 0.3 billion kg (9%).