Download Report
Below are highlights from the recently released trade data from the US Census Bureau and US Bureau of Economic Analysis. To view additional data and analysis related to the California economy visit our website at www.centerforjobs.org/ca.
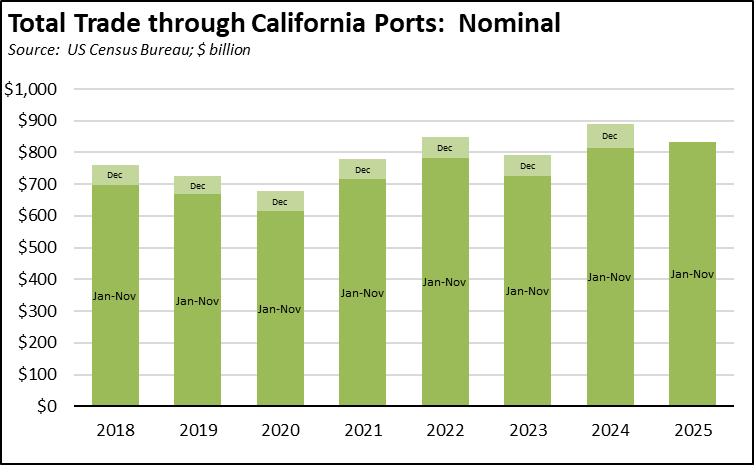
Although the trade numbers softened in November, total trade flows through the state’s ports remained on track to post the highest numbers ever in 2025, measured in both nominal and real terms.

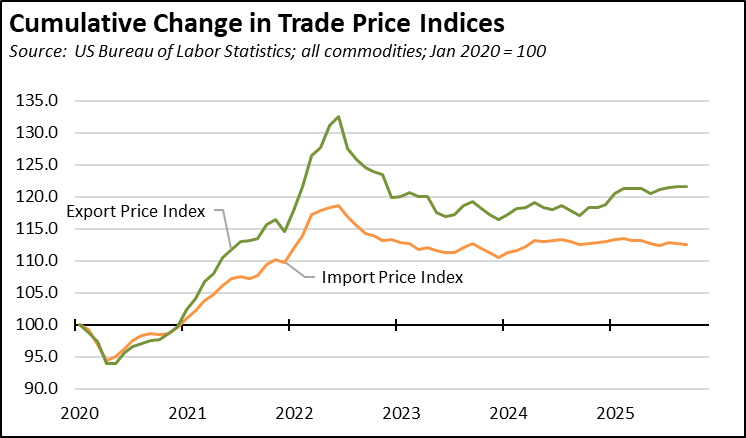
Import prices continued to hold steady, while export prices also maintained their recent rise.

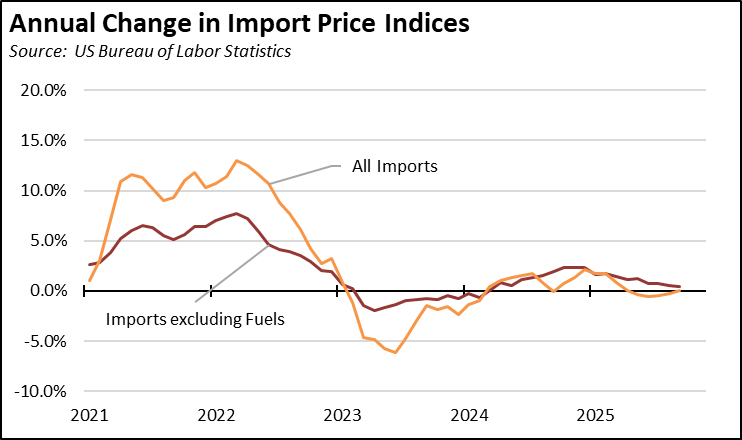
Removing the more volatile fuels components, import prices for all other goods have steadily slowed since their peak growth in Fall 2024, heavily influenced by substantial deflationary pressures in China coming from excess production combined with soft domestic consumption.
Share of Goods through US Ports
16.3%
CA Share of Total Trade
Through US Ports
The share of total US goods trade (exports and imports) through California ports continued dropping to 16.30% (12 month moving average; compared to 16.33% in October 2025 and 16.62% in November 2024).
California remained the #2 state, behind Texas which had a 19.82% share (compared to 19.74% in October 2025 and 20.04% in November 2024). Trade through the Atlantic port states was at 30.28% (compared to 30.21% in October 2025 and 29.11% in November 2024). These trade flows form the trade-related base for one of California’s largest centers of middle-class, blue-collar jobs.
California Goods Exports
-$0.6
Billion Change
in Exports
Total California origin goods exports were down $0.6 billion from November 2024 (down 4.0%). California remained in 2nd place with 8.68% of all US goods exports (12 month moving total), behind Texas at 20.77%.
California Goods Imports
-$3.0
Billion Change
in Imports
Total California destination goods imports fell by $-3.0 billion from November 2024 (down -7.2%).
Top 20 Exports, November 2025
Top 20 exports by value are shown below, along with the change from Nov 2024.
| NAICS Commodity | Nov 2025 Exports ($b.) | Change from Nov 2024 |
|---|
| Computer Equipment | $2.1 | 21.0% |
| Fruits & Tree Nuts | 1.6 | 10.9% |
| Aerospace Products & Parts | 0.9 | 55.9% |
| Navigational/measuring/medical/control Instrument | 0.8 | -9.5% |
| Pharmaceuticals & Medicines | 0.7 | 2.4% |
| Semiconductors & Other Electronic Components | 0.6 | -25.0% |
| Communications Equipment | 0.6 | 9.6% |
| Medical Equipment & Supplies | 0.5 | 5.1% |
| Electrical Equipment & Components, Nesoi | 0.4 | -37.7% |
| Waste & Scrap | 0.4 | -4.7% |
| Industrial Machinery | 0.4 | -24.3% |
| Other General Purpose Machinery | 0.3 | -4.0% |
| Commercial & Service Industry Machinery | 0.3 | -17.3% |
| Miscellaneous Manufactured Commodities | 0.3 | -27.6% |
| Motor Vehicle Parts | 0.3 | -10.6% |
| Foods, Nesoi | 0.3 | -15.6% |
| Other Fabricated Metal Products | 0.2 | -17.9% |
| Dairy Products | 0.2 | 34.9% |
| Electrical Equipment | 0.2 | 8.7% |
| Magnetic & Optical Media | 0.2 | 104.1% |
| | |
Top 10 Export Markets, November 2025
| Nov 2025 Exports ($b.) | Change from Nov 2024 |
|---|
| Mexico | $2.4 | -13.3% |
| Taiwan | 1.6 | 78.4% |
| Canada | 1.4 | -21.7% |
| Japan | 0.9 | -8.3% |
| China | 0.8 | -46.1% |
| Netherlands | 0.8 | -8.0% |
| Korea, South | 0.7 | -1.9% |
| Germany | 0.5 | -12.9% |
| United Kingdom | 0.4 | 5.8% |
| Singapore | 0.4 | 3.7% |
| | |