Below are highlights from the recently released trade data from the US Census Bureau and US Bureau of Economic Analysis. To view additional data and analysis related to the California economy visit our website at www.centerforjobs.org/ca.
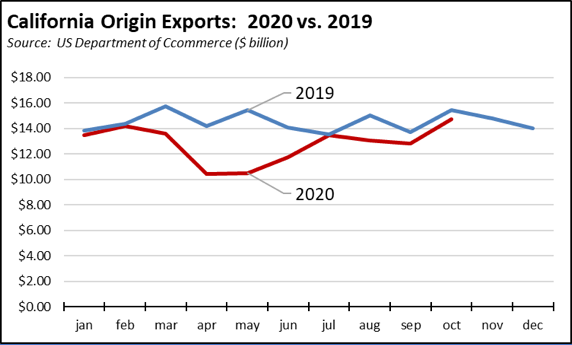
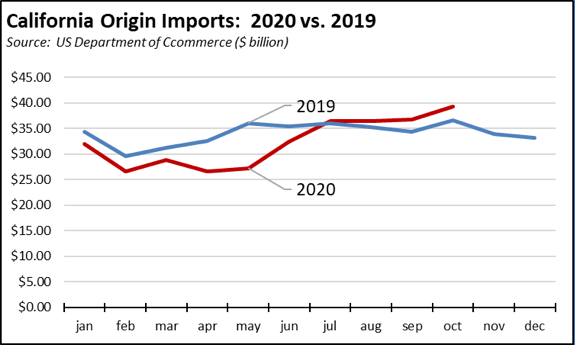
California origin exports—including both products produced in the state and products aggregated by exporting firms—showed further recovery but remained below the 2019 levels. Origin imports—both products used in the state and aggregated by state-based importers for subsequent distribution to other states—continued to surge above the 2019 numbers.
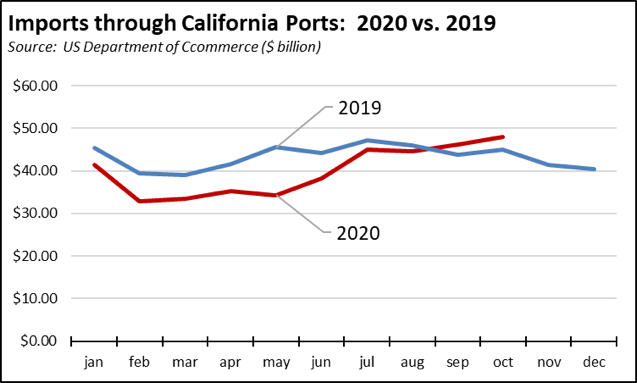
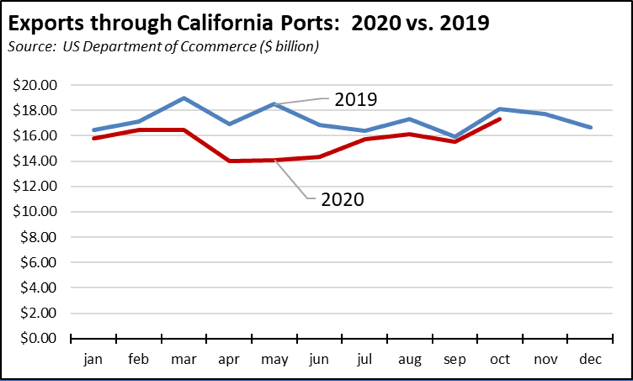
The same pattern was seen in overall trade activity through the state’s ports, with imports dominating a rise in port activity.
Despite the current economic downturn, trade activity is straining the capacity of ports both in California and much of the rest of the nation. Measured by TEU (twenty-foot equivalent unit containers), October activity at the Port of Los Angeles was the busiest in its 114-year history, while Port of Long Beach also broke its previous record reached this year in September.
The state ports play a crucial role in combating income inequality by supporting one of the state’s largest remaining centers of higher wage blue collar jobs. Yet, state transportation infrastructure spending continues to underinvest in one of the few areas where California retains a strong competitive advantage for these types of jobs. Driven by the climate change policies, the state’s infrastructure investments focus more on projects such as public transit—which even prior to the current downturn saw dramatic drops in ridership even as the systems were expanded—and High Speed Rail which has few if any prospects of either reducing emissions or benefiting lower income residents.
California Goods Exports Decrease
Total California goods exports were down $0.8 billion from October 2019 (down 5%). California remained in 2nd place with 10.85% of all US goods exports (12 month moving total), behind Texas at 19.81%.
California's Balance for Goods Trade
California’s balance of goods trade activity through state businesses broadened to -$24.7 billion reflecting the upsurge in import activity, compared to -$21.1 billion in October 2019. California trade accounted for 28% of the US trade deficit in goods in October 2020.
Reflecting the extent to which the state’s climate change program has not as much reduced emissions as shifted where those emissions are produced—including countries such as China with a heavy and growing reliance on coal—the October number is 61% above the average in 2010, the year when the initial climate change actions under AB 32 began.
Top 20 Exports, October 2020
Top 20 exports by value are shown below, along with the change from October 2019.
By shipping weight (vessel and air total), the leading export was Waste & Scrap at 0.9 billion kg (30% of total exports), followed by Petroleum & Coal Products at 0.7 billion kg (24%), and Fruits & Tree Nuts at 0.3 billion kg (8%).