Download Report
Below are highlights from the recently released trade data from the US Census Bureau and US Bureau of Economic Analysis. To view additional data and analysis related to the California economy visit our website at www.centerforjobs.org/ca.
Overall trade levels showed some mixed results in the October data. Both origin exports and destination imports (including both goods produced/used in the state as well those identified with other states but supporting California supply chain jobs such as in wholesaling and freight forwarders) were down compared to October 2022.
In nominal terms, total trade through the state’s ports, however, was up 1.7% compared to a year ago, and the state’s share of total goods trade through US ports remained in an essentially level trough on a 12-month moving average basis. While resolution of the West Coast labor negotiations and potential shift of labor issues to the Atlantic ports appear to have helped staunch the loss in market share on which millions of California jobs depend, drought affecting traffic through the Panama Canal also continues to provide a temporary competitive edge to the California ports.
Again in nominal terms, total trade through the state’s ports year-to-date was down from the same period during the banner year of 2022, but up 8.6% from the previous “normal” year in 2019.
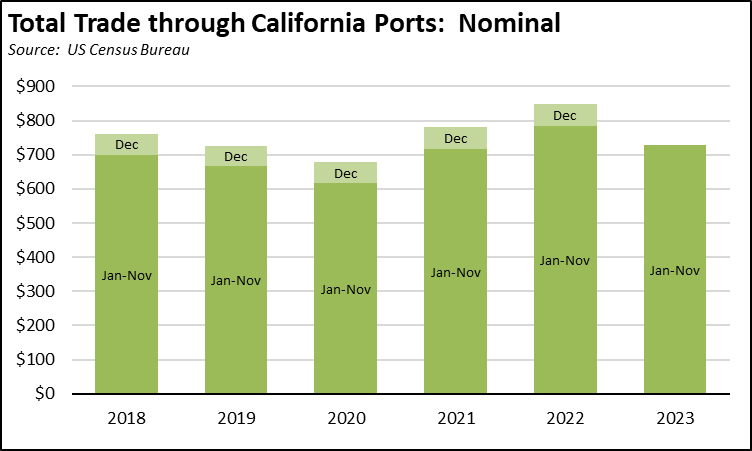
In constant dollars, however, total trade through the ports is down from the same period in the previous two years, and remains 4.2% short of recovering to the 2019 levels.
Share of Goods through US Ports
15.4%
CA Share Of Total Trade
Through US Ports
The share of total US goods trade (exports and imports) through California ports edged up to 15.42% (12 month moving average; compared to 15.37% in September 2023 and 16.14% in October 2022).
California remained the #2 state, behind Texas with 20.09% (compared to 20.09% in September 2023 and 19.61% in October 2022). Trade through the Atlantic port states was at 30.08% (compared to 30.11% in September 2023 and 29.6% in October 2022). In spite of remaining in the second place spot, the state’s continued position forms the trade-related base for one of California’s largest centers of middle-class, blue-collar jobs. Transportation & Warehousing alone provided 813,800 in the most recent data for October, and has led the state in job creation both during and coming out of the pandemic.
California Goods Exports
-$0.1
Billion Change In Exports
Total California goods exports were down $0.1 billion from October 2022 (down 0.9%). California remained in 2nd place with 8.84% of all US goods exports (12 month moving total), behind Texas at 22.07%.
California Goods Imports
-$1.3
Billion Change In Imports
Total California destination goods imports dropped $1.3 billion from October 2022 (down 3.1%).
Top 20 Exports, October 2023
Top 20 exports by value are shown below, along with the change from Oct 2022.
| NAICS Commodity |
Oct 2023 Exports ($b.) |
Change from Oct 2022 |
| Fruits & Tree Nuts |
$1.0 |
18.8% |
| Semiconductors & Other Electronic Components |
1.0 |
16.1% |
| Aerospace Products & Parts |
1.0 |
20.4% |
| Navigational/measuring/medical/control Instrument |
0.9 |
6.9% |
| Computer Equipment |
0.9 |
-10.0% |
| Communications Equipment |
0.7 |
-7.8% |
| Pharmaceuticals & Medicines |
0.7 |
-2.1% |
| Electrical Equipment & Components, Nesoi |
0.6 |
39.7% |
| Medical Equipment & Supplies |
0.6 |
8.8% |
| Miscellaneous Manufactured Commodities |
0.5 |
-25.4% |
| Petroleum & Coal Products |
0.5 |
46.8% |
| Industrial Machinery |
0.5 |
-44.9% |
| Waste & Scrap |
0.4 |
-0.7% |
| Other General Purpose Machinery |
0.3 |
16.7% |
| Used Or Second-hand Merchandise |
0.3 |
21.4% |
| Motor Vehicle Parts |
0.3 |
11.6% |
| Commercial & Service Industry Machinery |
0.3 |
-7.3% |
| Other Fabricated Metal Products |
0.3 |
16.2% |
| Motor Vehicles |
0.3 |
-47.5% |
| Plastics Products |
0.3 |
4.6% |
|
|
|
Top 10 Export Markets, October 2023
| Country |
Oct 2023 Exports ($b.) |
Change from Oct 2022 |
| Mexico |
$3.3 |
19.8% |
| Canada |
1.6 |
-16.2% |
| China |
1.4 |
-14.4% |
| Japan |
0.9 |
-0.9% |
| Taiwan |
0.7 |
-17.3% |
| Korea, South |
0.7 |
-28.4% |
| Hong Kong |
0.5 |
-7.8% |
| Netherlands |
0.5 |
4.8% |
| Australia |
0.5 |
55.4% |
| Germany |
0.4 |
-0.8% |
|
|
|