Download Report
Below are highlights from the recently released trade data from the US Census Bureau and US Bureau of Economic Analysis. To view additional data and analysis related to the California economy visit our website at www.centerforjobs.org/ca.
Trade through the state’s ports picked up in October compared to the prior month, led by a surge in imports. Total trade through the state’s ports was higher by $7.4 billion (10.3%), of which $7.2 billion was from imports. The results added to the year-to-date totals which continue to outpace prior years in nominal terms. The real value numbers are not available this month as the October trade price indices were not published due to the federal shutdown.
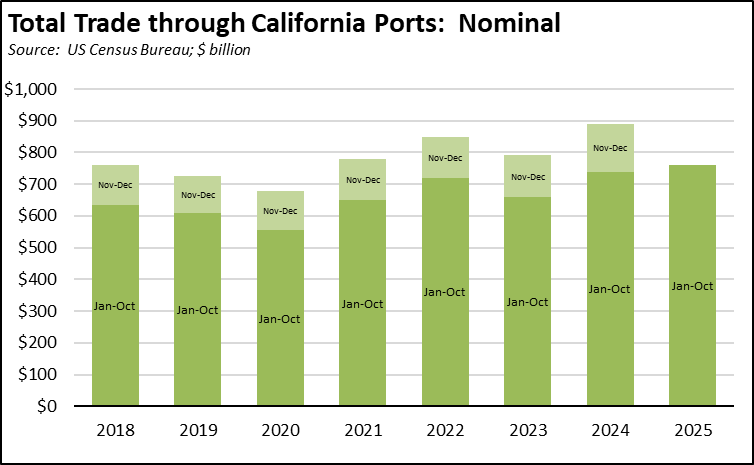
Compared to the prior year, total trade through the ports was off by $4.3 billion (-5.1%), however, October 2025 looks remarkably similar to October 2024. Both origin exports and destination imports showed only insignificant change.
Share of Goods through US Ports
16.3%
CA Share of Total Trade
Through US Ports
The share of total US goods trade (exports and imports) through California ports dipped to 16.33% (12 month moving average; compared to 16.44% in September 2025 and 16.54% in October 2024).
California remained the #2 state, behind Texas which had a 19.74% share (compared to 19.65% in September 2025 and 20.02% in October 2024). Trade through the Atlantic port states was at 30.21% (compared to 30.04% in September 2025 and 29.14% in October 2024). These trade flows form the trade-related base for one of California’s largest centers of middle-class, blue-collar jobs.
California Goods Exports
$0.0
Billion Change
in Exports
Total California origin goods exports were only $22.7 million higher compared to October 2024 (up 0.1%). California remained in 2nd place with 8.74% of all US goods exports (12 month moving total), behind Texas at 20.92%.
California Goods Imports
$0.0
Billion Change
in Imports
Total California destination goods imports also were only marginally up by $46.3 million compared to October 2024 (up 0.1%).
Top 20 Exports, October 2025
Top 20 exports by value are shown below, along with the change from Oct 2024.
| NAICS Commodity | Oct 2025 Exports ($b.) | Change from Oct 2024 |
|---|
| Computer Equipment | $2.5 | 45.4% |
| Fruits & Tree Nuts | 1.3 | 11.2% |
| Pharmaceuticals & Medicines | 0.9 | 52.4% |
| Navigational/measuring/medical/control Instrument | 0.8 | -7.2% |
| Semiconductors & Other Electronic Components | 0.8 | -17.7% |
| Communications Equipment | 0.8 | 24.7% |
| Aerospace Products & Parts | 0.7 | -27.5% |
| Medical Equipment & Supplies | 0.6 | 7.5% |
| Electrical Equipment & Components, Nesoi | 0.5 | -35.1% |
| Petroleum & Coal Products | 0.4 | -2.1% |
| Nonferrous (exc Aluminum) & Processing | 0.4 | 160.1% |
| Motor Vehicle Parts | 0.3 | 3.0% |
| Industrial Machinery | 0.3 | -15.3% |
| Waste & Scrap | 0.3 | -15.5% |
| Used or Second-hand Merchandise | 0.3 | -14.8% |
| Other General Purpose Machinery | 0.3 | -20.6% |
| Commercial & Service Industry Machinery | 0.3 | -40.6% |
| Other Fabricated Metal Products | 0.3 | -7.5% |
| Electrical Equipment | 0.3 | 18.3% |
| Foods, Nesoi | 0.3 | -11.4% |
| | |
Top 10 Export Markets, October 2025
| Oct 2025 Exports ($b.) | Change from Oct 2024 |
|---|
| Mexico | $3.4 | 6.2% |
| Canada | 1.5 | -15.1% |
| Taiwan | 1.2 | 71.8% |
| Japan | 0.9 | 3.0% |
| Netherlands | 0.9 | 16.5% |
| China | 0.8 | -45.6% |
| Korea, South | 0.6 | -13.4% |
| United Kingdom | 0.5 | -15.9% |
| Germany | 0.5 | 9.0% |
| Singapore | 0.5 | -2.7% |
| | |