Below are highlights from the recently released trade data from the US Census Bureau and US Bureau of Economic Analysis. To view additional data and analysis related to the California economy visit our website at www.centerforjobs.org/ca.
Share of Goods through US Ports
17.8%
CA Share of Total Trade
Through US Ports
The share of total US goods trade (exports and imports) through California ports edged up to 17.78% (12 month moving average; compared to 17.66% in August 2020 and 17.81% in September 2019).
California remained the #1 state, ahead of Texas with 17.21% (compared to 17.30% in August 2020 and 17.71% in September 2019). Trade through the Atlantic port states was at 30.57% (compared to 30.49% in August 2020 and 29.74% in September 2019). The state’s continued lead in this area forms the trade-related base for one of California’s largest centers of middle-class, blue-collar jobs. Transportation & Warehousing alone provided 630,100 jobs in September (down from 654,500 in September 2019), paying an average annual salary of $62.0k. This employment base in turn supports additional blue-collar and white-collar jobs in a range of other industries.
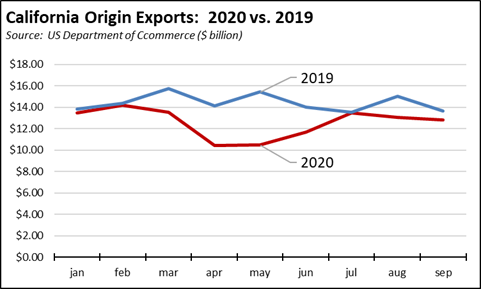
California Goods Exports Decrease
-$0.9b
Billion in Exports
Total California goods exports were down $0.9 billion from September 2019 (down 6.4%). California remained in 2nd place with 10.82% of all US goods exports (12 month moving total), behind Texas at 19.96%.
California's Balance for Goods Trade
-$23.9b
Billion of Goods Trade
California’s balance of goods trade activity through state businesses broadened to -$23.9 billion, compared to a level of -$20.7 billion in September 2019. California trade accounted for 28% of the US trade deficit in goods in September 2020.
Top 20 Exports, September 2020
Top 20 exports by value are shown below, along with the change from September 2019.
By shipping weight (vessel and air total), the leading export was Waste & Scrap at 1.0 billion kg (35% of total exports), followed by Petroleum & Coal Products at 0.9 billion kg (31%), and Fruits & Tree Nuts at 0.2 billion kg (6%).
| Commodity |
Sep 2020 Exports ($b.) |
Change from Sep 2019 |
| Industrial Machinery |
$0.9 |
64.8% |
| Semiconductors & Other Electronic Components |
0.8 |
-3.2% |
| Computer Equipment |
0.8 |
18.0% |
| Fruits & Tree Nuts |
0.8 |
-1.9% |
| Navigational/measuring/medical/control Instrument |
0.7 |
-9.9% |
| Pharmaceuticals & Medicines |
0.7 |
14.2% |
| Miscellaneous Manufactured Commodities |
0.5 |
-26.8% |
| Aerospace Products & Parts |
0.5 |
-43.6% |
| Communications Equipment |
0.5 |
-19.8% |
| Medical Equipment & Supplies |
0.4 |
-3.7% |
| Waste & Scrap |
0.4 |
37.2% |
| Electrical Equipment & Components, Nesoi |
0.3 |
-18.3% |
| Other General Purpose Machinery |
0.3 |
18.7% |
| Motor Vehicles |
0.3 |
-0.5% |
| Used Or Second-hand Merchandise |
0.2 |
-38.0% |
| Motor Vehicle Parts |
0.2 |
-0.4% |
| Foods, Nesoi |
0.2 |
-2.4% |
| Petroleum & Coal Products |
0.2 |
-39.1% |
| Basic Chemicals |
0.2 |
-8.2% |
| Commercial & Service Industry Machinery |
0.2 |
-35.2% |
|
|
|
Top 10 Export Markets, September 2020
| Country |
Sep 2020 Exports ($b) |
Change from Sep 2019 |
| Mexico |
$2.0 |
-9.6% |
| Canada |
1.5 |
1.5% |
| China |
1.3 |
20.3% |
| Japan |
0.9 |
-6.0% |
| Korea, South |
0.7 |
-7.2% |
| Taiwan |
0.6 |
-16.1% |
| Hong Kong |
0.6 |
-27.4% |
| India |
0.5 |
27.0% |
| Germany |
0.5 |
0.2% |
| Netherlands |
0.4 |
-14.6% |
|
|
|