Below are highlights from the recently released trade data from the US Census Bureau and US Bureau of Economic Analysis.
The September data saw an expansion in exports in both nominal and real terms, while imports slowed as companies sought to correct prior overstocking of inventories and as consumer spending shifted to services rather than goods. Total trade through the state’s ports was up only 3.9% over the year in nominal terms, representing a contraction in real terms, but still showed elevated levels compared to the pre-pandemic period, with total trade up 18.0% in nominal terms compared to September 2019. Compared to pre-pandemic levels in September 2019, exports were up 13% in nominal terms—largely unchanged in real terms—while imports were up 22.7%.
As measured by the New York Federal Reserve Global Supply Chain Pressure Index, supply congestion continued easing globally in recent months but still remained somewhat elevated from prior periods. Continued easing is likely, but will come more from expected slowing in economic conditions and continued disruptions from lockdowns in China rather than structural and process improvements to goods movement infrastructure.
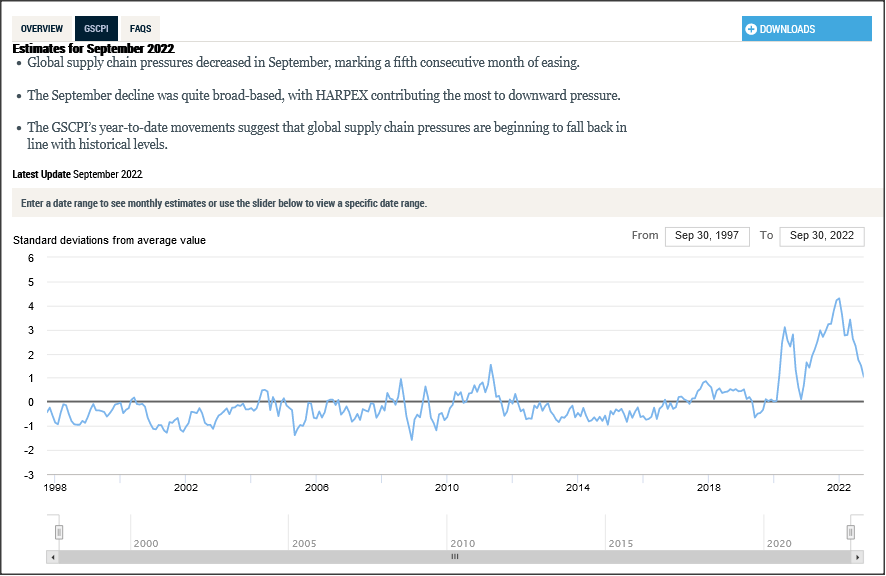
Source: New York Federal Reserve
Within California, congestion of the San Pedro Bay ports is down substantially in line with the easing of total trade traffic. The latest report for November 3 cites 22 vessels at anchor or loitering, of which only one is a container ship. The situation in the coming months, however, remains highly uncertain. The West Coast port labor talks remain stalled and still harbor the risk of labor actions affecting the movement of goods. More broadly, the railroad labor settlement previously brokered by the White House continues to unravel as more unions vote to reject the terms.
Share of Goods through US Ports
16.3%
CA Share Of Total Trade
Through US Ports
The share of total US goods trade (exports and imports) through California ports continued its decline to 16.27% (12 month moving average; compared to 16.42% in August 2022 and 17.59% in September 2021). California’s trade position has been eroding consistently since reaching its near-term high of 18.27% in March 2021, and long-term is down from previous highs of around 20% at the beginning of the 2000s.
California remained the #2 state, ahead of Texas with 19.48% (compared to 19.37% in August 2022 and 17.6% in September 2021). Trade through the Atlantic port states was at 29.55% (compared to 29.59% in August 2022 and 30.35% in September 2021).
While the state’s trade position continues a decline, it still provides a trade-related base for one of California’s largest centers of middle-class, blue-collar jobs. Transportation & Warehousing has been the only industry showing substantial growth since the beginning of the pandemic period, posting an overall growth of 117,900 workers (17.7%) between February 2020 and the latest data for September 2022. Total nonfarm jobs recovery in the seasonally adjusted series in contrast still remains below the pre-pandemic peak.
California Goods Exports
$1.4
Billion Change In Exports
Total California goods exports were up $1.4 billion from September 2021 (up 10%). California remained in distant 2nd place with 9.15% of all US goods exports (12 month moving total), behind Texas at 23.42%.
California Goods Imports
$0.5
Billion Change In Imports
Total California destination goods imports eased $0.5 billion from September 2021 (down 1.1%).
Top 20 Exports, September 2022
The top 20 exports by value are shown below, along with the change from September 2021.
| NAICS Commodity | Sep 2022 Exports ($b.) | Change from Sep 2021 |
| Semiconductors & Other Electronic Components | $1.1 | 8.5% |
| Industrial Machinery | 0.9 | -4.7% |
| Navigational/measuring/medical/control Instrument | 0.9 | 11.7% |
| Computer Equipment | 0.8 | 7.3% |
| Aerospace Products & Parts | 0.8 | 40.6% |
| Fruits & Tree Nuts | 0.8 | -5.8% |
| Pharmaceuticals & Medicines | 0.7 | -9.1% |
| Miscellaneous Manufactured Commodities | 0.6 | -2.9% |
| Communications Equipment | 0.6 | 9.1% |
| Medical Equipment & Supplies | 0.5 | 14.4% |
| Waste & Scrap | 0.5 | 5.7% |
| Commercial & Service Industry Machinery | 0.4 | 49.0% |
| Electrical Equipment & Components, Nesoi | 0.4 | 20.0% |
| Used Or Second-hand Merchandise | 0.4 | 21.0% |
| Petroleum & Coal Products | 0.3 | 21.6% |
| Other General Purpose Machinery | 0.3 | 26.5% |
| Basic Chemicals | 0.3 | 3.0% |
| Foods, Nesoi | 0.3 | 12.6% |
| Motor Vehicle Parts | 0.3 | 56.2% |
| Dairy Products | 0.3 | 27.8% |
| | |
Top 10 Export Markets, September 2022
| Country | Sep 2022 Exports ($b.) | Change from Sep 2021 |
| Mexico | $2.5 | 12.1% |
| Canada | 1.6 | 5.5% |
| China | 1.5 | 10.1% |
| Japan | 1.0 | 8.4% |
| Taiwan | 0.8 | 6.0% |
| Korea, South | 0.8 | -2.9% |
| Germany | 0.6 | 15.0% |
| Netherlands | 0.6 | 25.4% |
| Hong Kong | 0.6 | -1.9% |
| Singapore | 0.5 | 11.7% |
| | |