Download Report Below are highlights from the recently released trade data from the US Census Bureau and US Bureau of Economic Analysis. To view additional data and analysis related to the California economy visit our website at www.centerforjobs.org/ca.
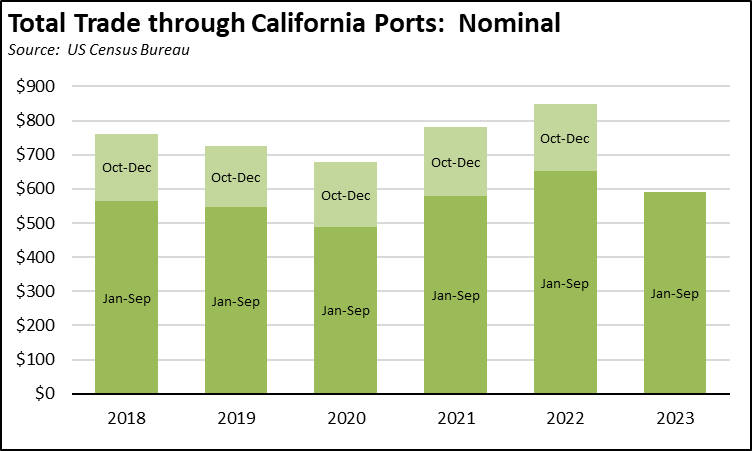
Overall trade levels were off compared to September 2022, although California’s total share of trade through US ports saw a pause in its decline (on a 12-month moving basis) for the first time since March 2021. In nominal terms, origin exports edged down 3.3% from last September, destination imports were off 4.3%, and total trade through the state’s ports were only marginally lower at 0.7%. Compared to the pre-pandemic levels, however, all activity levels were higher.
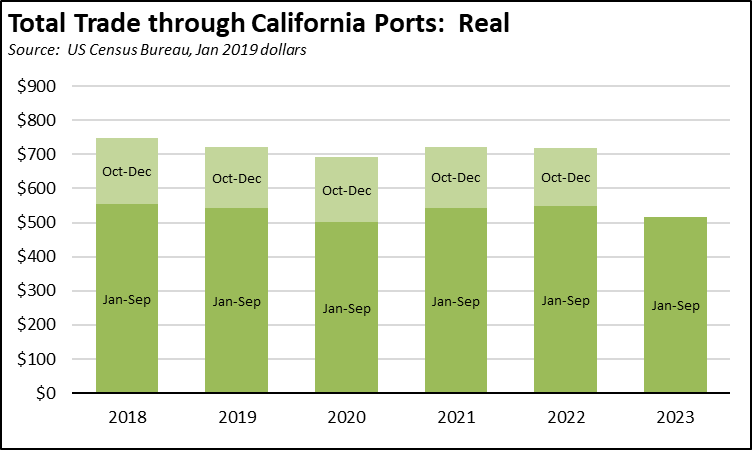
In real terms, total trade continues to lag the pre-pandemic numbers. Cumulatively through September, the 2023 performance is 4.7% lower than the same period in 2019, reflecting the shift of some traffic away from the California ports during the recent labor negotiations.
Share of Goods through US Ports
15.4%
CA Share Of Total Trade
Through US Ports
The share of total US goods trade (exports and imports) through California ports edged up to 15.37% (12 month moving average; compared to 15.32% in August 2023 and 16.26% in September 2022).
California remained the #2 state, behind Texas with 20.09% (compared to 20.11% in August 2023 and 19.5% in September 2022). Trade through the Atlantic port states was at 30.11% (compared to 30.09% in August 2023 and 29.55% in September 2022). The September results indicate some stabilization in the trade-related base for one of California’s largest centers of middle-class, blue-collar jobs. Transportation & Warehousing alone provided 799,500 wage and salary jobs in the latest results for September 2023, the primary growth industry in the state during the pandemic.
California Goods Exports
-$0.5
Billion Change In Exports
Total California goods exports were down $0.5 billion from September 2022 (down 3.3%). California remained in 2nd place with 8.83% of all US goods exports (12 month moving total), behind Texas at 22.12%.
California Goods Imports
-$1.8
Billion Change In Imports
Total California destination goods imports were down $1.8 billion from September 2022 (down 4.3%).
Top 20 Exports, September 2023
Top 20 exports by value are shown below, along with the change from Sep 2022.
| NAICS Commodity | Sep 2023 Exports ($b.) | Change from Sep 2022 |
| Semiconductors & Other Electronic Components | $1.0 | -4.7% |
| Navigational/measuring/medical/control Instrument | 0.9 | -3.5% |
| Aerospace Products & Parts | 0.9 | 13.3% |
| Computer Equipment | 0.8 | -2.5% |
| Fruits & Tree Nuts | 0.7 | -3.5% |
| Pharmaceuticals & Medicines | 0.7 | 1.3% |
| Communications Equipment | 0.6 | 8.5% |
| Medical Equipment & Supplies | 0.6 | 4.5% |
| Miscellaneous Manufactured Commodities | 0.6 | -10.3% |
| Petroleum & Coal Products | 0.5 | 50.2% |
| Industrial Machinery | 0.5 | -46.9% |
| Electrical Equipment & Components, Nesoi | 0.5 | 23.0% |
| Waste & Scrap | 0.4 | -22.6% |
| Other General Purpose Machinery | 0.3 | 10.6% |
| Used Or Second-hand Merchandise | 0.3 | -7.7% |
| Motor Vehicle Parts | 0.3 | 9.4% |
| Basic Chemicals | 0.3 | -3.6% |
| Commercial & Service Industry Machinery | 0.3 | -29.7% |
| Other Fabricated Metal Products | 0.2 | 0.4% |
| Plastics Products | 0.2 | -5.2% |
| | |
Top 10 Export Markets, September 2023
| Country | Sep 2023 Exports ($b.) | Change from Sep 2022 |
| Mexico | $3.0 | 17.4% |
| Canada | 1.6 | -3.2% |
| China | 1.2 | -21.1% |
| Japan | 0.9 | -16.9% |
| Korea, South | 0.8 | 3.7% |
| Hong Kong | 0.7 | 21.6% |
| Taiwan | 0.6 | -22.0% |
| Germany | 0.5 | -15.8% |
| Netherlands | 0.5 | -17.5% |
| India | 0.4 | -17.3% |
| | |