Below are highlights from the recently released trade data from the US Census Bureau and US Bureau of Economic Analysis. To view additional data and analysis related to the California economy visit our website at www.centerforjobs.org/ca.
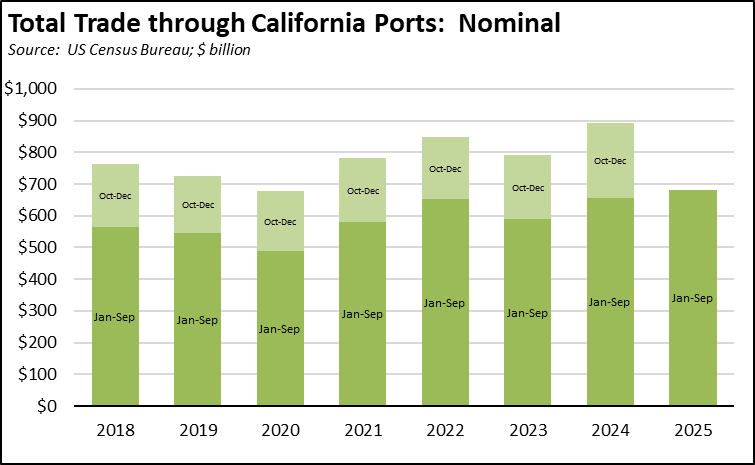
Reflecting levels typically seen in September as tariff-induced and holiday related surges eased, total trade through the state’s ports dropped $5.2 billion (-6.7%) from October and $7.8 billion (-9.8%) compared to September 2024. Compared to a year ago, exports through the state’s ports were up marginally, while total trade was driven lower by a $7.9 billion drop in imports.
Origin exports saw little change from October with a gain of only $105.4 million (0.7%), and similarly only a $396.5 million (-2.5%) dip over the year. Destination imports saw a more substantial shift from October, dropping $5.1 billion (-11.6%), but only a marginal gain over the year of $611.2 million (1.6%).
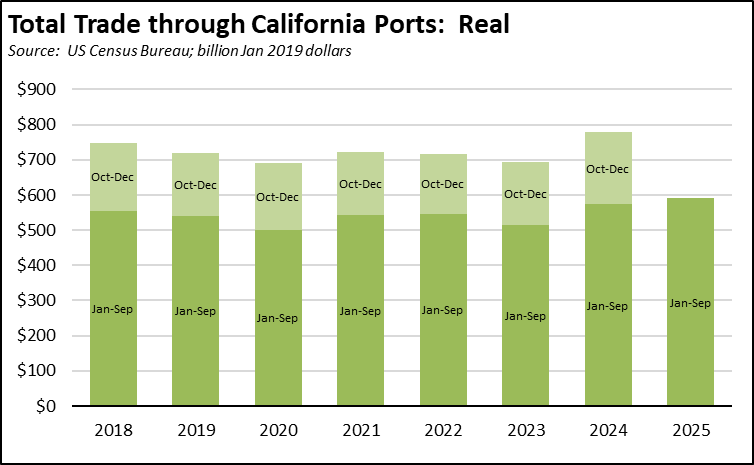
Year-to-date total trade handled by the state’s ports remained well above prior years, measured in both nominal and real terms.
After 4 months of deflationary levels, import prices saw a marginal pick-up at 0.3% over the year, while export prices continued to rise at 3.8%, their highest level since 2022.
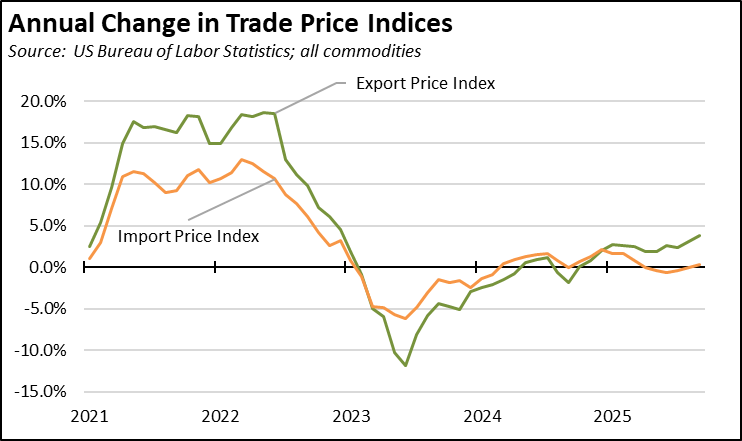
On a cumulative basis, import prices remain largely stable, while export prices maintained a slow but relatively steady rise.

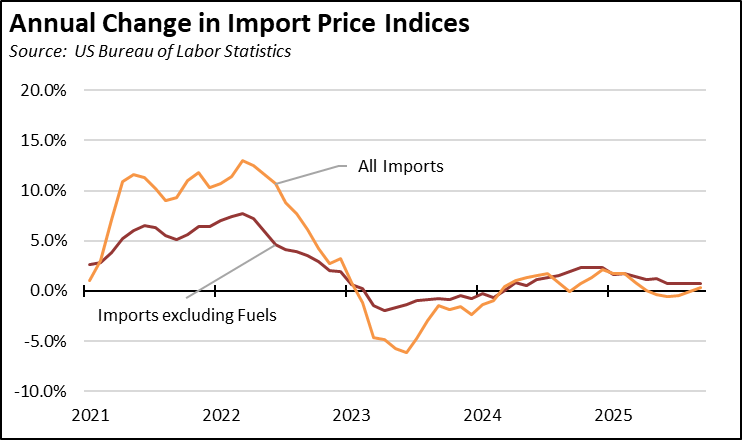
Removing the more volatile energy component—in the current situation, due to lower world oil prices—the shift in import prices comes more from changes in all other imports.
California Goods Exports
in Exports
Total California origin goods exports were down $0.4 billion from September 2024 (down 2.5%). California remained in 2nd place with 8.85% of all US goods exports (12 month moving total), behind Texas at 21.17%.
Exports by Region
Exports Through 2025:Q2
Based on US Census Bureau data for selected MSAs, total exports from Southern California fell 1.9% from 2024:Q2 to 2025:Q2, compared to the listed Bay Area MSAs at 24.5% and the overall US average of 6.2%.
Exports by Region
California Goods Imports
in Imports
Total California destination goods imports dropped $-5.1 billion from September 2024 (down -11.6%).
Top 20 Exports, September 2025
Top 20 exports by value are shown below, along with the change from Sep 2024.