The latest new vehicle sales data from California New Car Dealers Association indicates that sales are now projected to be above 1.9 million units for the year. Although slowing 4% from the prior year, this indicator reflects the level of overall consumer confidence and continuing strength of the recovery. New vehicle sales are also a critical indicator of state and local revenues, with Motor Vehicle and Parts Dealers (NAICS 441) producing 13% of total taxable sales in the most recent data for the first quarter in 2018.

Light Trucks at 56% of Sales
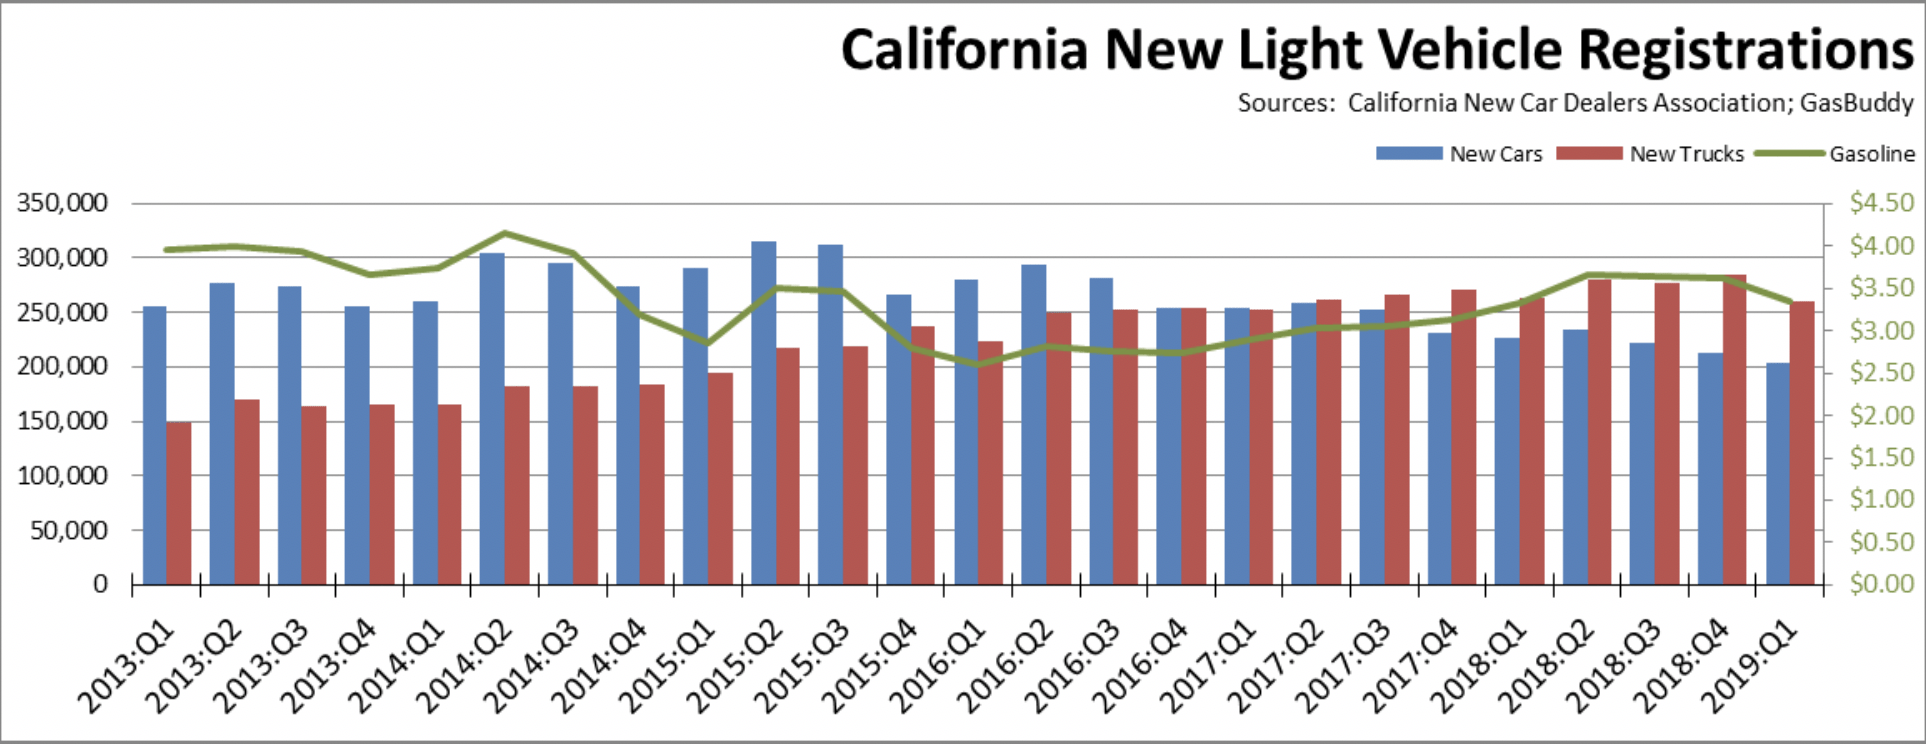
- Light truck market share in the quarter was down marginally to 56.1%, compared to 57.3% in Q4 2018 and 53.6% in Q1 2018.
- Consumer shifts to light trucks for the US outside California similarly showed only a marginal change, accounting for 69.9% of new light vehicle sales. The potential for California’s ZEV policies to be replicated beyond its borders remains low as the market segment targeted by most Plug-in Electric Vehicle (PEV) models—cars—continues to remain low as a result of consumer preferences.
- The average California price for regular gas in Q1 2019 was $3.34 a gallon, the same as the year prior.
PEV Sales Mixed Results in 1st Quarter
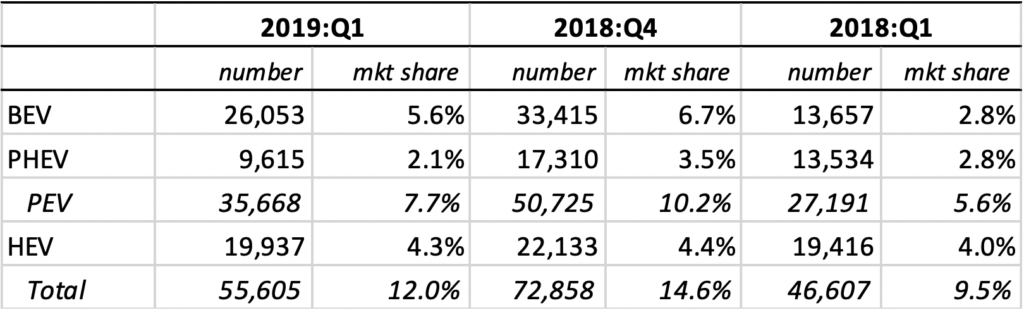
Source: Derived from California New Car Dealers Association
- Compared to the same quarter a year ago, PEV sales were up 31%. However, comparing quarter-to-quarter, sales dropped 30% from Q4 2018.
- Battery Electric Vehicles (BEVs) sales remained elevated but down from the prior quarter (from 6.7% to 5.6% share of total sales), primarily as Tesla has moved from completing deliveries on its order backlog for Model 3 to current sales from its direct order system. As their sales shift is completed, the quarterly sales numbers will better reflect the longer term market and potential market penetration for ZEVs. Tesla sales volume in this quarter was 20,491 (15,805 of which were Model 3), or 79% of all BEVs sold in the state. Chevy Bolt, generally in the same price range as Model 3, shows only 2,285 units for the quarter.
While the comparative performance of the Model 3 and Bolt suggest that pricing alone is not the dominant factor in consumer decisions for these vehicles to date, expansion of BEV sales to moderate income consumers will be affected by the availability of state and federal credits and other pricing issues, as illustrated in areas that have pulled back on subsidies (e.g., Georgia, Denmark, Netherlands) or substantially increased them (e.g., Norway). California has already eliminated its credits to the primary BEV consumers through enactment of income limits. Both Tesla and GM have since passed the 200,000 sales threshold after which the federal credits are phased out. Nissan previously was expected to become the third automaker to reach this limit, but lower-than-expected sales of its Leaf model have pushed the expected date further out. Tesla recently halted online-ordering of its long awaited $35,000 Model 3 option shortly after it was introduced, although press reports indicate this version is still available through phone and in-store sales.
Press reports also indicate Tesla has shifted to China and Europe to rebuild its sales volume. These moves include recent introduction of Model 3 in China and current construction of its Gigafactory 3 in Shanghai. US Census Bureau trade data shows California origin exports of motor vehicles—of which Tesla is the only remaining California producer—in the first three months of 2019 jumped by $1.1 billion to the EU, and by $0.3 billion to China for February and March.
- Plug-in Hybrid Vehicles (PHEVs) showed one of the strongest shifts in this quarter, plunging 31% from Q1 2018 and 44% from Q4 2018. While these sales losses were replaced by the overall BEV gains, the drop in PHEVs combined with the softening BEV sales produced the decline in the PEV total.
Alternative Market Share Still Above Long-term Trend but Softening
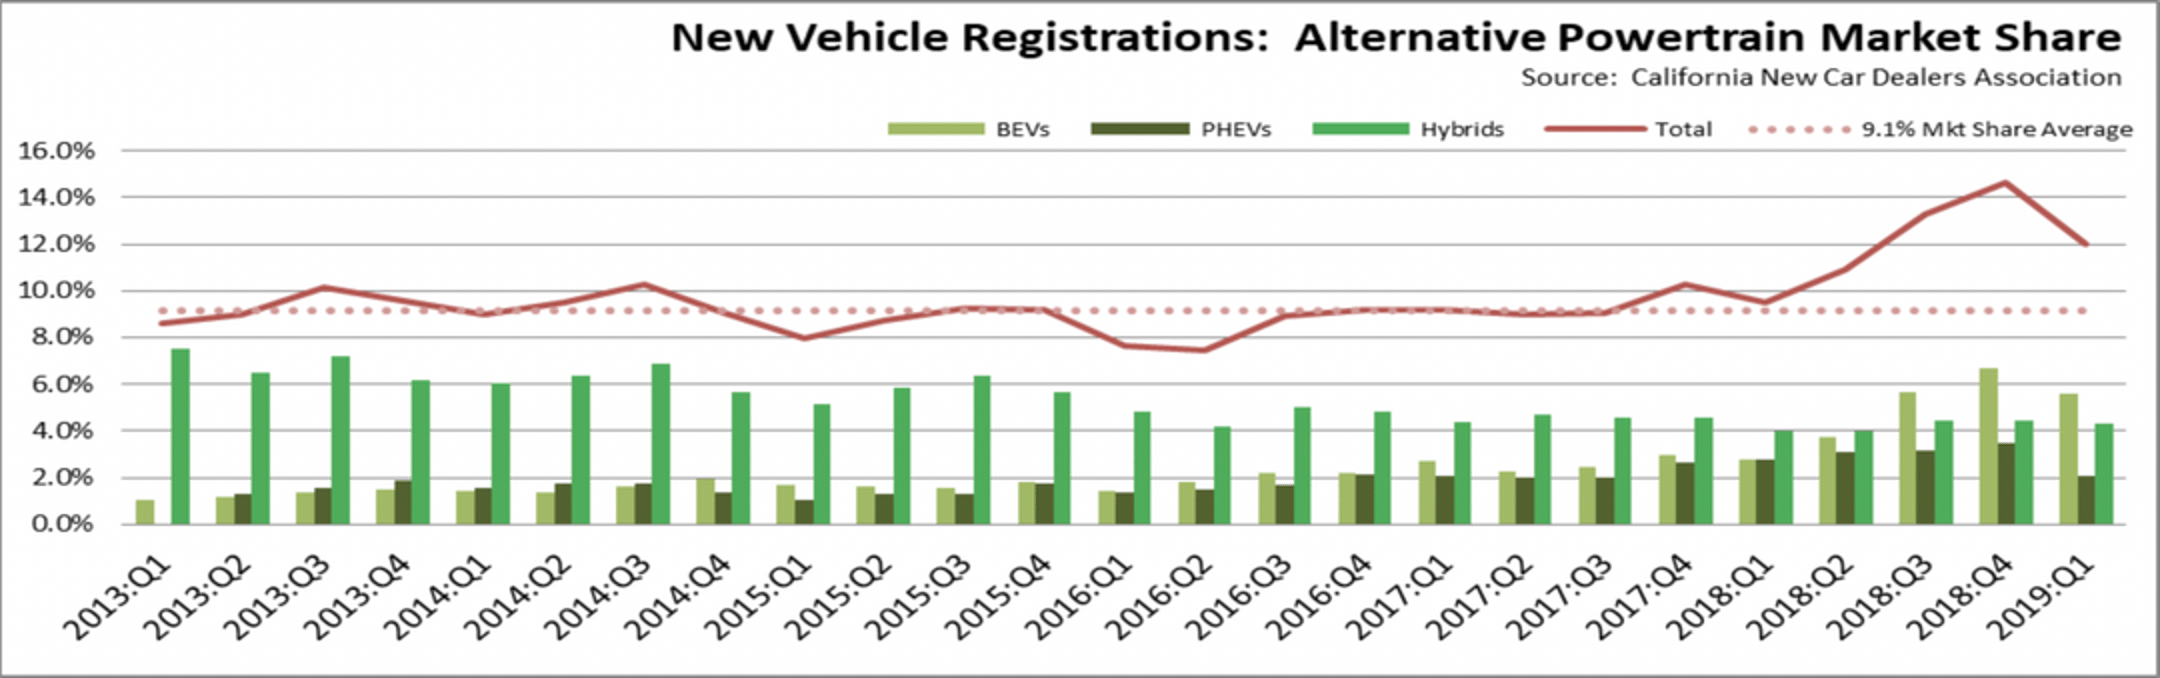
- Until recent data was taken over by Tesla’s backlog deliveries, the longer term trend line for sales of alternative fuel vehicles deviated little from an average market share of 9.1%. The sales mix instead changed as consumers open to these vehicles shifted from battery Hybrid Vehicles (HEVs) to PEVs as more models became available in that class.
- HEV market share, however, has stabilized in recent quarters. After dropping to a low of 4.0% in the first half of 2018, it has been level at 4.3% – 4.4% now in the past 3 quarters, possibly suggesting consumers no longer view these vehicles as transitional technology but as the option for those shopping primarily based on fuel efficiency. This stability is in marked contrast to the plunge in sales of the combustion vehicle component of the ZEV mix, PHEVs as discussed above.
- The most recent quarter results show the total alternative market share dropping from the recent high of 14.6% in the previous quarter to 12.0%.
- Whether the longer term trend line resets closer to this quarter’s results or whether 12.0% is only a point to something lower remains dependent on the extent to which the combustion vehicle component of the mix—PHEVs and HEVs—turn out to be transitional technologies as many analysts expect or due to price competitiveness, remain the primary offering from the state’s regulations available to middle and lower income buyers. In the case of current policy proposals for vehicle fuels, including those that would further shrink an already isolated and volatile state fuels market, this factor will define the degree to which such policies will shift the cost of these policies even more onto the moderate and lower income portion of the population.
- Additional pricing uncertainty and consequent long term market share also is subject to the continuing dispute between California and the federal government over the state’s ZEV waiver and proposed amendments to the Corporate Average Fuel Economy (CAFÉ) regulations. With federal credits expiring as producers reach their sales ceilings, the subsidies made possible through expanding the sale of regulatory credits created under the prior ZEV/CAFE structure become more significant to vehicle pricing. While shifting the cost burden from public coffers to an unadvertised charge on consumers buying traditional cars and trucks, these credits were previously set to take on an increasing role in subsidizing future sales of these vehicles, in particular BEV models currently targeted to the higher income segments of the market.
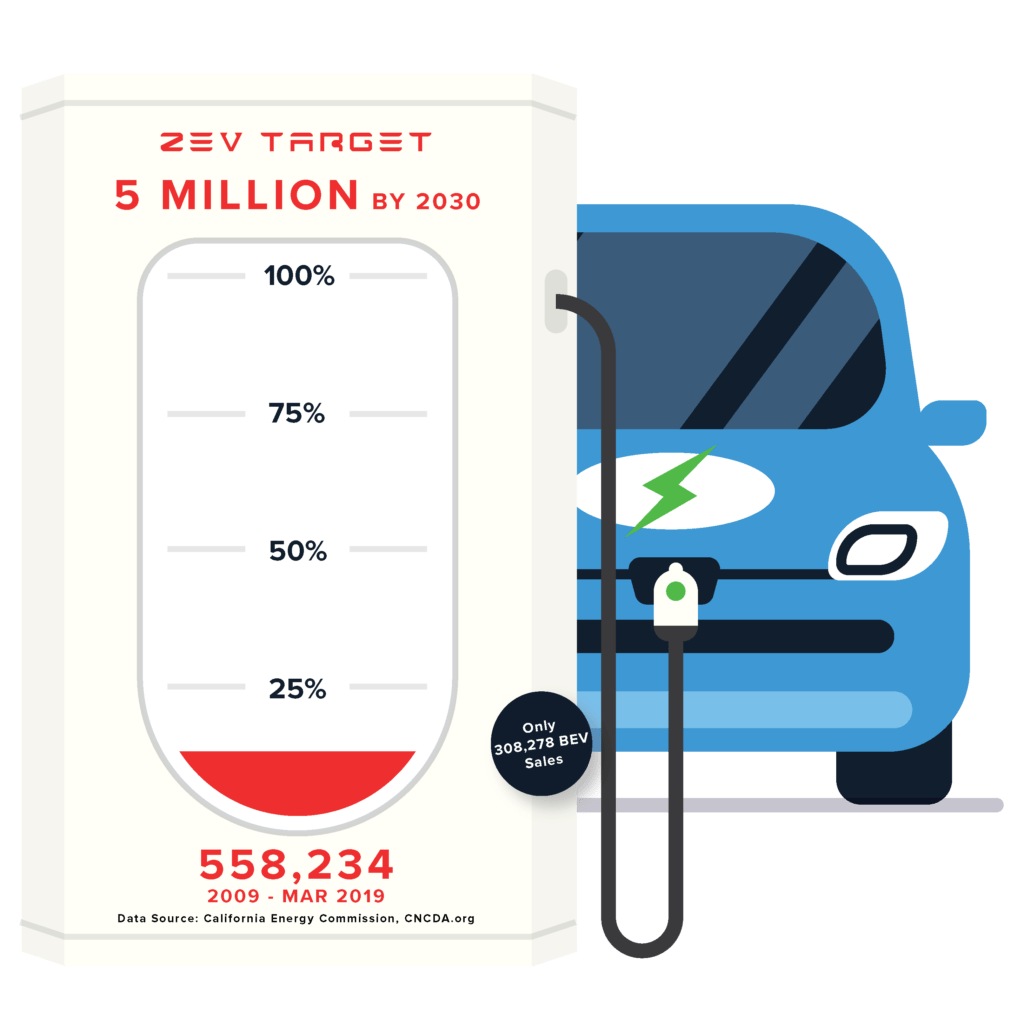
Cumulative PEV Sales at 11.2% of 2030 Goal—True ZEVs at 6.2%
As part of the AB 32 climate change program, Executive Order B-48-18 administratively created a goal of 5 million zero-emission vehicles (ZEVs) on California roads by 2030. This action expands on the prior Executive Order B-16-2012, which set a goal of 1.5 million by 2025, with a sub-goal that their market share is expanding at that point. While these goals were set administratively, they are embodied in the state’s climate change strategies, and both public and utility ratepayer funds are being used to create the refueling infrastructure required for these motorists.
Rather than only true ZEVs, the numbers in the Executive Order and previous interpretations by the agencies indicate the goal is to be achieved by both BEVs that run only on electricity and combustion PHEVs that run on both electricity and motor fuels. Consequently, only a portion of the vehicles being counted to meet the zero emission goal—roughly half based on current sales volumes—will in fact produce zero emissions when driven. Additionally, FCEVs (fuel cell electric vehicles) also would count towards the ZEV total, but CNCDA data show total market share for these vehicles to date at around 0.1%.
Using this more flexible interpretation that includes both true ZEVs and combustion PHEVs, total PEV sales since 2009 account for 11.2% of the 2030 goal. True ZEV sales, however, account for only 6.2%.
Disparity Between Vehicle Sales & Vehicles On the Road
In addition to the distortion that comes from including combustion vehicles in the ZEV total, the Executive Orders also refer to ZEVs on California roads while the agency accountings rely on sales as the measure of progress. Using prior Energy Commission reviews to account for ZEVs no longer on the roads as a result of accidents, moves out of state, and other factors that over time remove vehicles from the active fleet, the actual progress rate consistent with the Executive Order language of “vehicles on California’s roads” would be 10.3% rather than the 11.6% shown in the chart below.
Carpool lane sticker data, however, suggests the differences may be even higher. As part of the overall subsidy packages available to ZEV buyers, the state also issues Clean Air Vehicle (CAV) stickers that allow single-occupant ZEVs to use carpool lanes. Qualifying ZEV models change periodically, in particular PHEVs that no longer meet the overall emission standards issued by the Air Resources Board. Currently, purple decals are issued for ZEVs purchased after January 1, 2019. Red decals were issued for vehicles previously having a white (BEV) or green (PHEV) sticker and purchased in 2017 or 2018. Owners of vehicles eligible for a red decal received a pre-filled in application which only needed to be signed and mailed to DMV with the $22 fee.
Comparing the DMV sticker data to the sales numbers suggests the actual number of ZEVs “on California’s roads” are lower. As shown in the table below, the number of purple stickers issued closely matches the first quarter PEV sales. The discrepancy arises primarily from the fact that the DMV data is from April 10 and includes 10 more days of sales than the Q1 data.
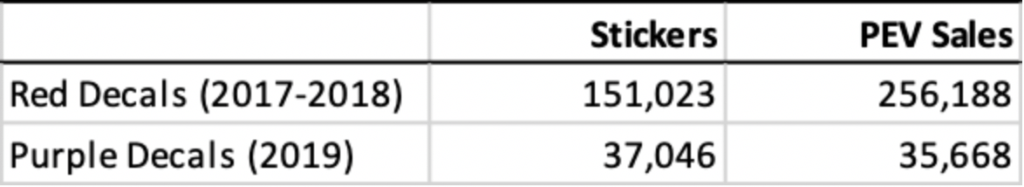
The difference for red decals is far greater. The number of stickers is roughly the same as just the number of BEVs alone (148,301) sold in 2017 and 2018. There are several reasons why the number of stickers should be somewhat lower but not to the extent shown in the table:
- Getting a red decal required previous owners of white and green stickers (both of which expired after 2018) to submit a new application to DMV. But the state sent pre-filled out forms to all eligible owners. And while the applications required payment of a new $22 fee, most PEV sales have been to higher income households where the fee cost likely is not an issue.
- Not every PEV is sold in areas where carpool lane access is an issue. But the vast majority are registered in zip codes where this perk would be desirable.
- Even in urban areas, carpool access is not necessarily a key issue with every PEV as survey data shows that many PEVs still are purchased by households as a second or subsequent vehicle, with traditional fuel vehicles still the primary means of commuting. Owners of older model PEVs may have found they just weren’t taking advantage of the sticker perks.
- Not all PEV models, primarily PHEVs, bought in 2017 and 2018 are still eligible for a sticker. However, the Air Board’s web site still shows 30 eligible PHEV models from these years.
PEVs in general are sold more to higher income, relatively more mobile households. Especially with continuing shifts of expansions and some current operations by key higher-wage industries such as Tech, Information, and Finance to other states, PEVs owned by their higher income employees may be shifting as well. The previous drop-off rates estimated by the Energy Commission may be too low, and the actual number of PEVs “on California roads” likely lower than shown in the adjusted numbers above.
PEV Sales by Income Levels
Various analyses in the past have assessed the extent to which PEVs remain a higher income product, and the degree to which these vehicles have been expanding to moderate and lower income consumers. Early analyses were based on detailed income, location, and demographic information that is no longer compiled. Subsequent ones looked at location data from the state’s vehicle rebates, but this information has covered a much smaller portion of overall PEV sales since implementation of the income limits.
In the charts below, the DMV zip code sticker data was converted into a uniform household penetration rate, with the calculation using the total stickers within each district and an estimated number of households from the statewide number of persons per household. The results were then graphed against per capita income (2017) for each district. The percentage of households estimated to have a PEV is overall an average rate as some households have more than one PEV.
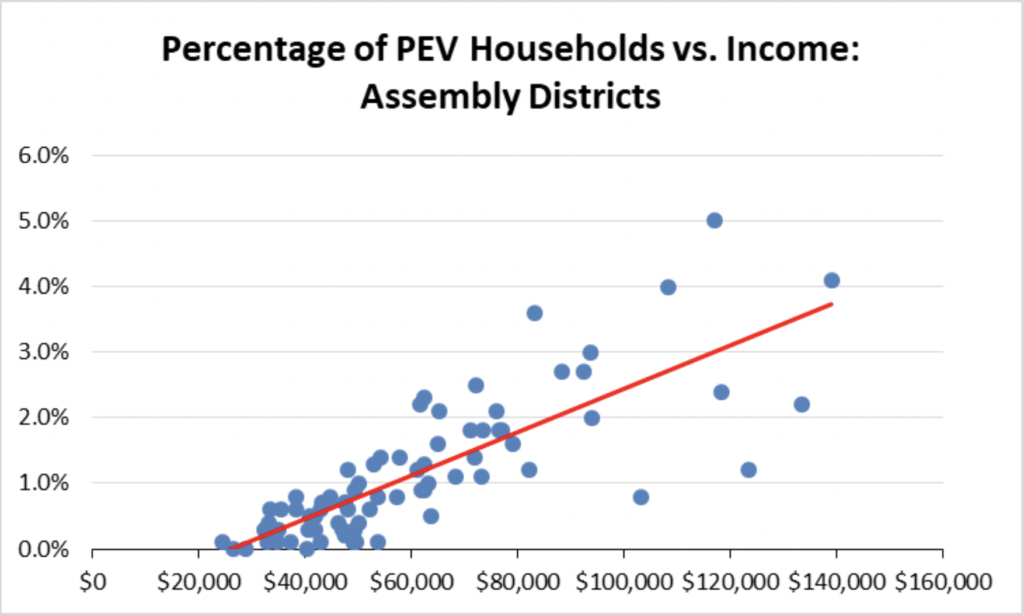
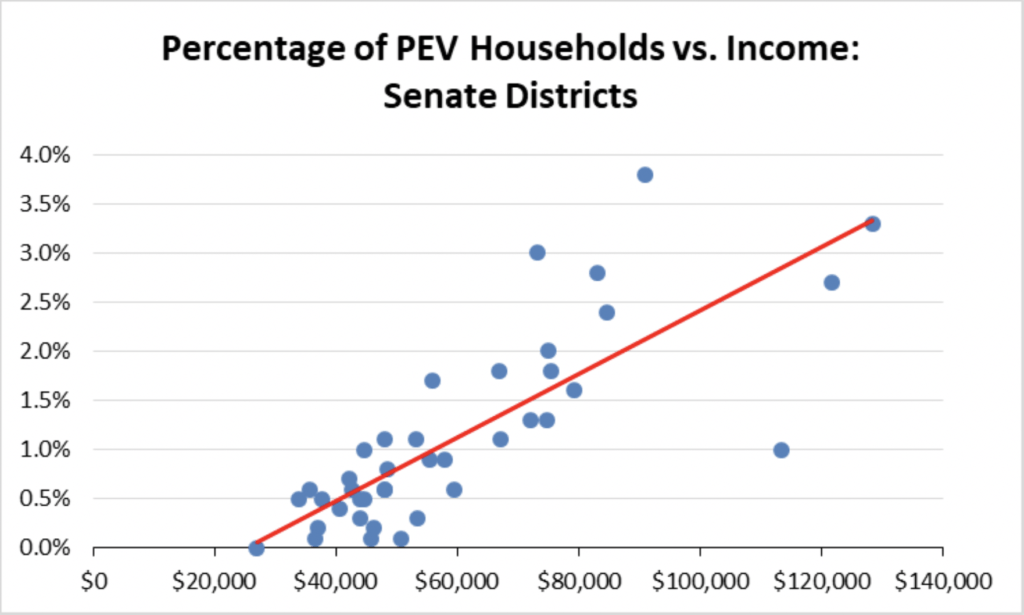
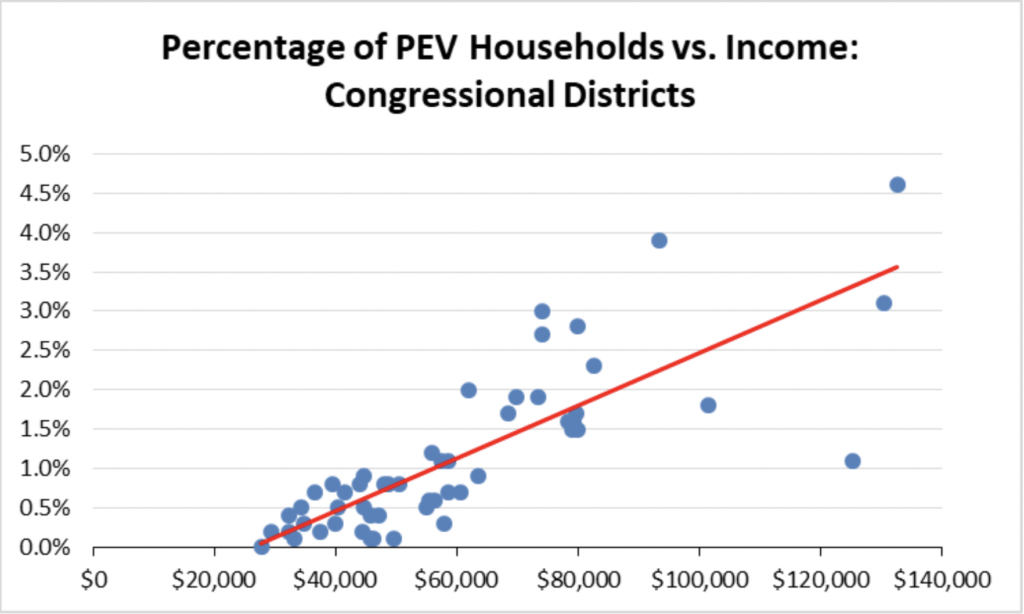
From these charts, the 48 Assembly Districts with household PEV ownership rates (2017-2019 models) of 1% or less have an average per capita income of $45,200, below the California average of $59,800. For Senate Districts, the comparable numbers are 24 districts with average per capita income of $47,400. For Congressional Districts, 32 districts with average per capita income of $44,600.
Battery Critical Materials Update
In February, the Center released a report assessing the risk to the state’s economy from potential shortfalls in the supply of battery critical materials, in particular cobalt. Tesla—which relies on lower cobalt battery chemistries—subsequently stated its own concerns over future supplies of critical materials including battery-grade nickel, copper, and lithium. Potential expansion of PEV sales in accordance with the Executive Orders and current state policy—at the same time other nations are pursuing similar goals—will be tempered by whether equivalent actions to address these supply issues and the growing dependence on unsecure sources will also be addressed.
In its most recent commodities production reports, US Geological Survey indicates world cobalt supplies have become even more concentrated within a single source. As shown in the chart below, revised mine production numbers for 2017 indicate the global share from Democratic Republic of the Congo (DRC) rose to 61%. Initial production estimates for 2018 show the DRC share rising even further to two-thirds of the world’s supply. USGS estimates that production in all other countries combined declined.
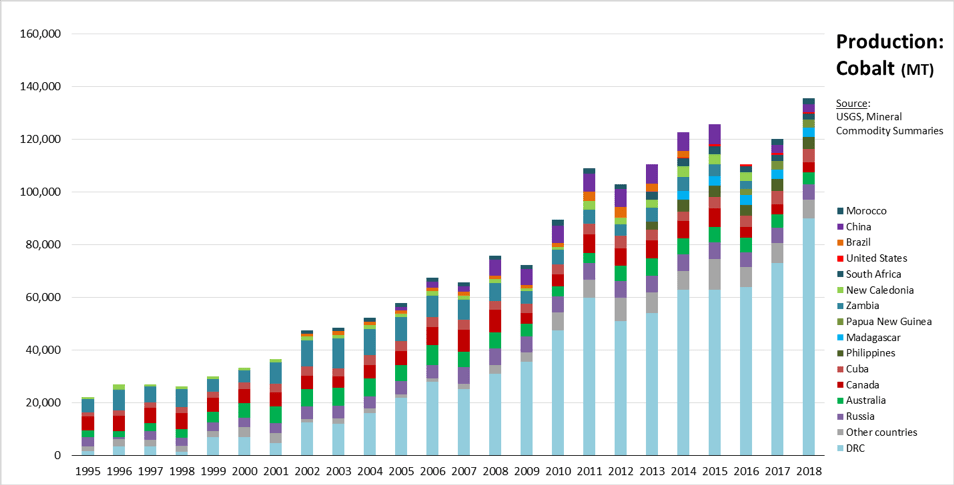
As detailed in the Center’s report, DRC is a highly volatile nation, with official corruption and virtually unceasing internal and external conflicts frequently disrupting supply flows from its mining sector. More critically, previous reports from Amnesty International and other NGOs have documented frequent abuses associated with the use of child labor, lack of worker safety, and environmental damage from artisanal mining along with mistreatment of women and other disenfranchised populations in the associated mining communities which are frequently run by rebel militia and elements of both the national and foreign militaries. Artisanal mining is estimated to provide about 20% of total DRC cobalt production.
Manufacturing Job Provisions of Executive Order B-16-2012 Still Not Implemented
Executive Order B-16-2012 contains a number of provisions calling for actions to expand the ZEV and ZEV component manufacturing base in California:
[By 2015] The State’s manufacturing sector will be expanding zero-emission vehicle and component manufacturing;
[By 2020] The private sector’s role in the supply chain for zero-emission vehicle component development and manufacturing State will be expanding.
[By 2025] The zero-emission vehicle industry will be a strong and sustainable part of California’s economy;
The state’s current energy costs, additional labor law restrictions and litigation risks, and lengthy permitting processes continue to limit the ZEV related manufacturers choosing to locate within California. Rather than tackle these well-documented barriers to new manufacturing jobs, the most recent version of the ZEV Action Plan instead calls primarily for data collection and conversations:
Moving forward, state government will play a central role connecting regions to share best practices, gathering economic data to measure ZEV market growth and ensuring our workforce is trained to meet future needs.
Like many other statements concerning job creation associated with the state’s environmental and energy policies, these provisions related to ZEVs primarily consist of promises with little in the way of concrete action to shift the other state policies and regulations standing in the way of creating these types of permanent jobs within the state. California does have a significant ZEV production presence from Tesla, but Tesla located here primarily because of the availability of a vacant vehicle production facility that was fully permitted and constructed. California previously had several such facilities, but instead of being repurposed to create new manufacturing jobs, they were instead mined to produce air quality emission credits.
ZEV and ZEV component producers requiring new facilities have instead gone to other states and countries providing the timing certainty on development decisions required by such a rapidly changing industry. Tesla chose Nevada for its Gigafactory 1 for this reason. Announcements from other companies since the last quarter include:
- After dropping earlier plans to locate the facility outside the US, GM announced a $300 million investment at an existing Michigan plant to produce a new electric vehicle model.
- Ford announced an $850 million retooling of its Flat Rock plant in Michigan to produce electric vehicles.
- Daimler announced a joint venture with China’s Geely to repurpose their underperforming Smart vehicle into a global brand.
- After considering joint ventures with established battery producers similar to Tesla’s relationship with Panasonic, Volkswagen announced its plans to build its own battery plant in Germany.
- China’s and Warren Buffet-backed BYD signed an agreement with Evant to build electric vehicles in South Australia.
- In a further step consolidating the electric vehicle industry in China rather than in California where it began, Volkswagen announced two new manufacturing plants in Anting and Foshan, capable of producing 600,000 vehicles annually.
- California-based Mullen Technologies signed a letter of intent to construct 1.3 million square feet of assembly, manufacturing, and R&D for its Qiantu K50 vehicle near Spokane, WA.