The latest new vehicle data from California New Car Dealers Association shows total new light vehicle registrations in the third quarter were down 19.6% from the same period in the prior year, an improvement over the 48.9% drop in the second quarter but still lagging well behind the overall national decline of 8.4%. In addition to the associated jobs impacts, new vehicle sales are also a critical component of state and local revenues, with Motor Vehicle and Parts Dealers (NAICS 441) producing 12% of total taxable sales in 2019.

Light Trucks Continue to Dominate Sales
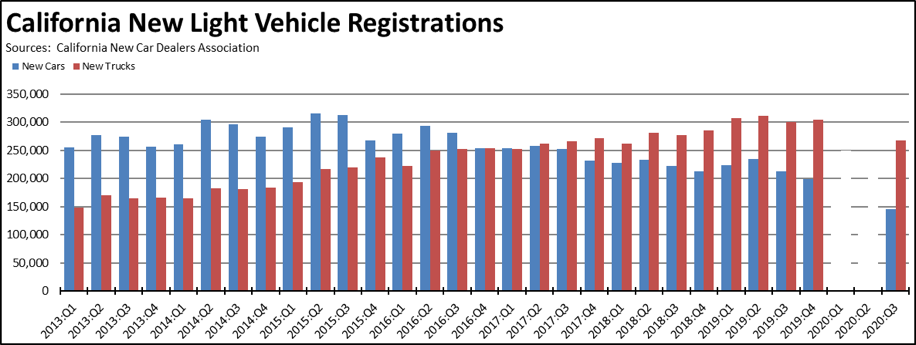
*2020 Q1 and Q2 data not available
- Californians continued their shift to light trucks, with the market share in the first half rising to 65%. For all states other than California, light trucks were at 76% of the market.
PEV Sales Down 14.7%
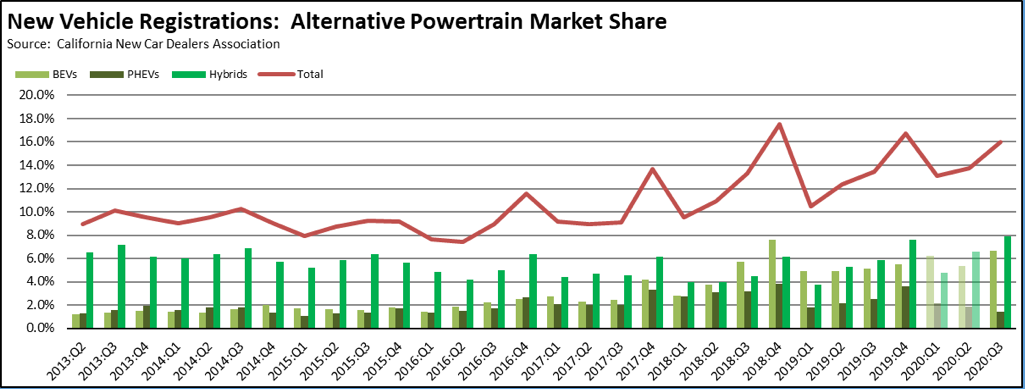
Source: Derived from California New Car Dealers Association
- In another indication of the disparate income effects of the ongoing reopening/shutdown cycle in the state, sales of the higher cost alternative fuel vehicles held up better as higher wage workers have been more able to retain their jobs and incomes through telecommuting.
- BEV (battery electric vehicles) registrations saw a slight increase from the 3rd quarter of 2019, reaching a 6.7% market share as registrations of traditional fuel vehicles were down more sharply. Total PEVs (plug-in electric vehicles) however were down as the PHEV (plug-in hybrid) component continued to show its high variability over the past several quarters.
- Standard hybrids (HEV) were the primary factor in maintaining the overall market share. Reflecting their now consistent trend of recovery following a drop at the beginning of the year, HEVs comprised 49% of the alternative fuel registrations, up from 42% in the same period in 2019.
- The combustion vehicle component of this market segment—PHEVs and HEVs—overall comprised 58% of the new registrations, again indicating a continuing hesitance on the part of consumers to shift to fully electric vehicles, either because of concerns over refueling and range or due to the remaining high bump in cost.
- Tesla remained the dominant producer of BEVs and consequently the primary beneficiary of the panoply of incentives and subsidies enacted by the regulatory agencies. However, Tesla sales in the quarter were down to 62% of all BEV registrations, a drop from its previous near monopoly over this segment. Future quarters will provide additional insight into whether this becomes a trend and whether the market is now evolving to a broader range of producers offering models that appeal to a larger share of consumers beyond the higher income segment targeted to date by Tesla.
- Overall market share has been rising, but continues to be driven heavily by the combustion-vehicle component, in particular the level of HEVs.
- While the maintenance of higher wage households has been more secure under the state’s restrictions, lower wage households have instead turned to the used vehicle market as transit use has collapsed throughout the state. The need for workers to suddenly secure alternative means to get to their jobs has seen an upsurge in prices for used vehicles both in California and the US. Applying the same weighting formula used by Department of Finance to calculate the California consumer price index to the individual components, prices for used cars and trucks increased only 0.4% between 2018 and 2019 in California, and 1.0% for the US as a whole. Between January and September of this year, the rush to find alternative transportation has seen used prices jump 11.0% so far in California and 12.4% in the US.
- In addition to illustrating another disparate impact on lower wage workers from the current shutdowns, these price increases also serve as a real-life example of the future costs lower wage workers will face as they experience more competition and less supply in the used market under the governor’s proposals for the elimination of gasoline vehicles.
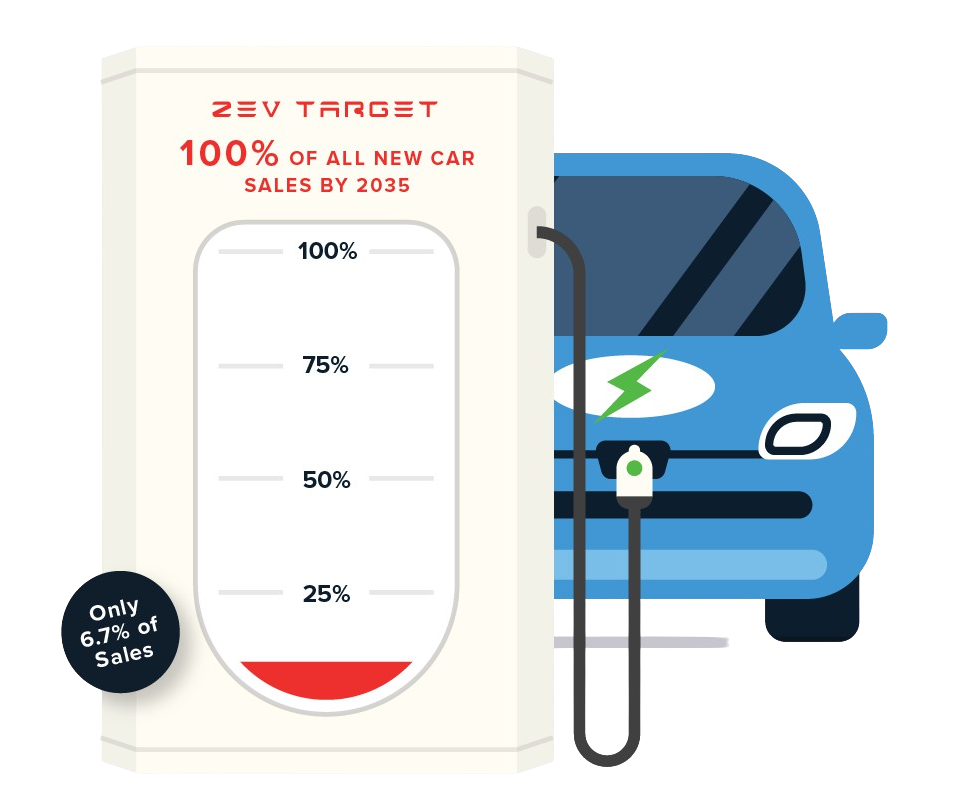
State Goal: 100% ZEVs by 2035
The state previously maintained a goal of 5 million zero-emission vehicles (ZEVs) on California roads by 2030 pursuant to Executive Order B-48-18. Under Executive Order N-79-20, the governor recently changed this goal to require all new vehicles offered for sale in the state to be ZEVs by 2035 for light duty cars and trucks, and by 2045 for heavy and medium duty vehicles.
The Order also directs the agencies to develop provisions for the phase out of the state’s downstream and upstream oil production facilities. Presumably this provision will require compliant ZEVs under the Order to be BEVs or other alternative power trains such as hydrogen-based fuel cells rather than continuing to count the combustion vehicle components (PHEVs) previously incorporated by the agencies to show progress towards the 5 million goal. The Order, however, is silent on provisions to replace other products from these facilities including aviation and marine fuels and a wide range of industrial inputs required by manufacturing and other industries in the state.
California’s sales mandates for ZEVs first began with the Air Board’s adoption of the LEV I regulations in 1990. After three decades, these mandates have resulted in ZEVs comprising 6.7% of new light vehicle registrations as measured against the diminished sales base in the third quarter. Even accepting that figure as the starting point, the current trendline estimated from a regression of the data to date shows sales are currently on track to reach the 100% market share target sometime in 2045. In 2035, sales would be only half of vehicles under current trends. Substantial deviation from trend would have to begin prior to 2025 in order to meet the 2035 goal, meaning sales over the next 4 years will be a critical measure of how viable this new goal is and an indication of the costs to workers and consumers required to meet it. Policy makers do not have to wait 15 years to determine whether the Order’s goal is viable or not.
State Goal: Vehicle Alternatives
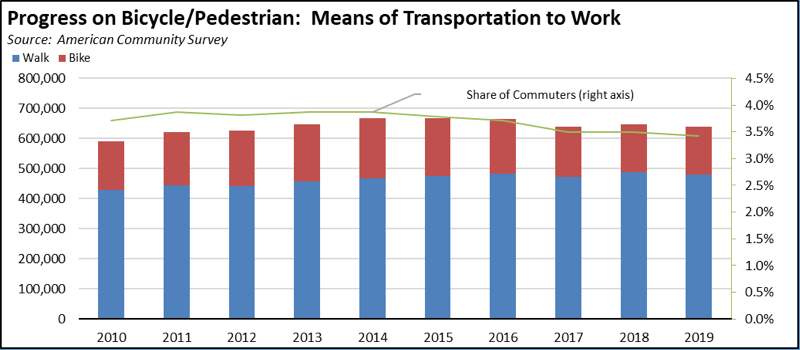
Additional provisions in the Order, among others, direct the agencies to develop actions and strategies to increase alternatives to vehicle use, notably transit, bicycles, and pedestrian options. These same components have been the core of existing strategies within the state’s climate program as well as planning and capital expenditures under the cap and trade program, transportation funding, and requirements place on private developments under the SB 375 and SB 743 programs. As detailed in the Center’s recent report on Telecommuting, these efforts have shown no substantive results to date. Instead, as use of these transportation modes has dropped even as capital investments have increased, the outcome has been increased rather than reduced emissions as reliance on vehicles has grown.
An indicator to track progress on the bicycle and pedestrian components of the Order is provided through the annual American Community Survey. The chart below shows the use of these options as the primary commute mode beginning in 2010, the year the early action items under AB 32 (establishing the state’s climate program) began. As indicated, the number of commuters using these two modes rose slightly through 2014, but has dropped consistently since then even as these options have become more of a state priority including under the expanded transportation funding through higher fuel taxes enacted in 2017 through SB 1. Measured as a share of commuters, the drop has been even more, going from a peak of only 3.9% of commuters in 2013 and 2014, to 3.4% in 2019.
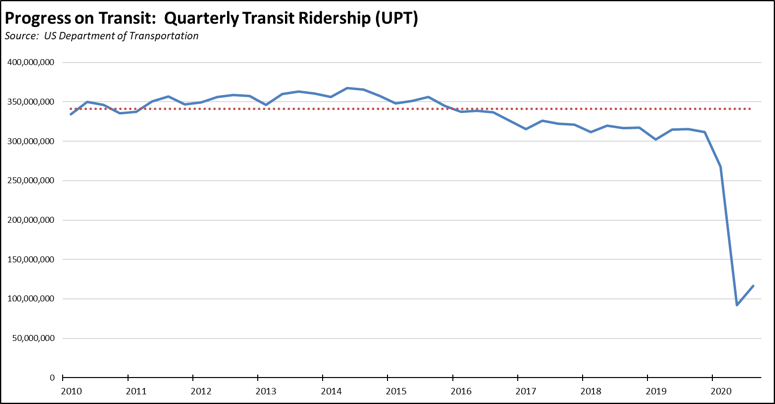
Transit use has shown steeper drops, even prior to the current collapse of ridership since the pandemic crisis began in March. As indicated below, transit use as measured by unlinked passenger trips (UPT) peaked in the second quarter of 2014, at only 7.6% above the average for 2010. In the fourth quarter of 2019, ridership was 8.6% below the 2010 average, for a total drop of 16.2 points in spite of significant system expansions in this period. Ridership since plummeted during the current crisis and has yet to get anywhere near a recovery.