Electric Vehicle Sales Stall Out—Hybrid Sales Boom
Recent press reports have raised the question of whether California will miss the governor’s ZEV sales mandates, currently set at requiring that 35% of new light duty vehicle (LDV) sales in 2026 be qualifying plug-in electric vehicles (PEVs), 68% by 2030, and 100% by 2035. These questions are based on recent Energy Commission sales data showing that the annual PEV market share essentially showed no movement, notching up to only 25.3% in 2024 from 25.0% in 2023. In total, the Energy Commission data shows only 2,091 more PEVs were sold in California in 2024.
Data in the latest report from California New Car Dealers Association (CNCDA), however, indicates this sales plateau is not just a temporary glitch. PEV market share has instead been largely static over the past 8 quarters, averaging 25.2% with a variance of only 0.1%.
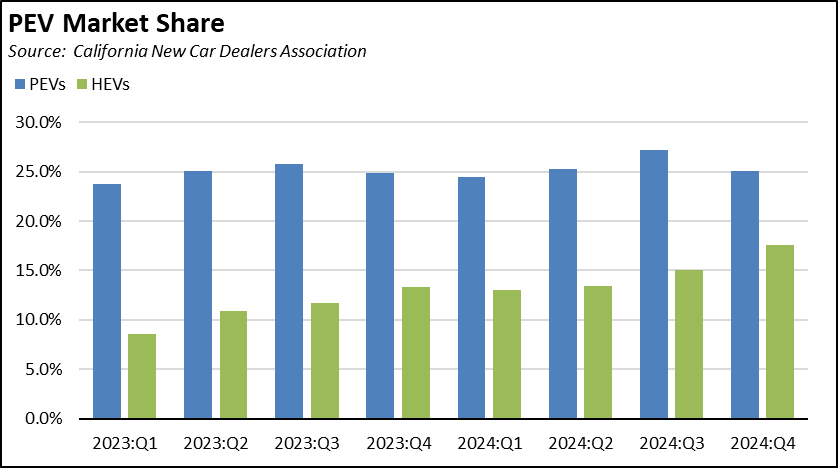
In stark contrast, battery hybrid (HEV) sales have been rising sharply, going from 8.6% in 2023:Q1, to 17.6% in the most recent results for 2024:Q4. Californians are open to power train alternatives and alternatives that reduce global warming emissions, but they still remain focused on the reliability and convenience of models with an internal combustion engine (ICE) component. Hybrids may be becoming more than just a temporary transition vehicle as long assumed in the state’s regulations. They instead represent the vehicle of choice in the market for many, starting with middle- and lower-income households looking for more affordable vehicles to both buy and operate.
This conclusion is even stronger when looking at the more complete results. Lumping the ICE component allowed under the state’s regulations—plug-in hybrids (PHEVs)—total hybrid sales in the 4th quarter nearly equaled sales of the true electric vehicle offerings (battery electric vehicles—BEVs).

As Californians have shifted their buying patterns, progress towards the 2026 mandate has fallen further behind and prospects for the 2030 and 2035 mandates becoming even less assured. Using 2023:Q1 as the starting base, PEV sales in 2024:Q4 would have had to be 20,200 higher (an additional 4.9% market share) to stay on track. In order to meet the 2026 regulation, PEV sales not only have to resume their expected growth trend, but catch up for past losses as well.

The ZEV slowdown is not limited to California. National data from Argonne National Laboratory shows PEV sales in 2024 at 9.8% of total LDV sales were only marginally higher than the 9.4% share in 2023. National PEV sales in the first two months of 2025 also remained stalled at the 9.8% level. In contrast, HEV sales similarly grew from 10.1% in 2023 to 11.8% in 2024.
Meeting the Governor’s Sales Mandate
Rather than legislative approval or actions by the voters, the current effort to revamp what vehicles Californians are allowed to buy is based on Executive Order N-79-20 which set a new goal calling for all new vehicles offered for sale in the state to be zero emission vehicles (ZEVs) by 2035 for light duty cars and trucks, and by 2045 for heavy and medium duty vehicles. The governor’s order was subsequently implemented through the Air Board’s Advanced Clear Cars II regulations, and the required federal waiver was issued in the waning days of the Biden Administration. US EPA recently submitted that waiver action for consideration under the Congressional Review Act. Regardless of the outcome, subsequent litigation is likely to keep the issue in limbo for some time.
Materials promoting or defending this program particularly in light of the recent federal action generally rely on the term “zero emission vehicles” coming from the executive order. The term, however, is misleading:
- Under the regulations, the definition of ZEV covers both fully electric vehicles (BEVs) and plug-in hybrids (PHEVs). Although what will qualify as a PHEV becomes stricter over time, the regulations allow 20% of vehicles sold in 2035 to be PHEVs which will still remain combustion vehicles with a battery component. For example, the Energy Commission recently announced Californians bought 108,303 “zero emission” vehicles in the 4th quarter of 2024, but 14% of those vehicles in fact produce emissions when they are being used and the extent they are driven under their combustion component continues to be unknown. They only become “zero emission” through a bit of bureaucratic obfuscation, and will still require the current fuels now being produced by the state’s declining refinery supply base.
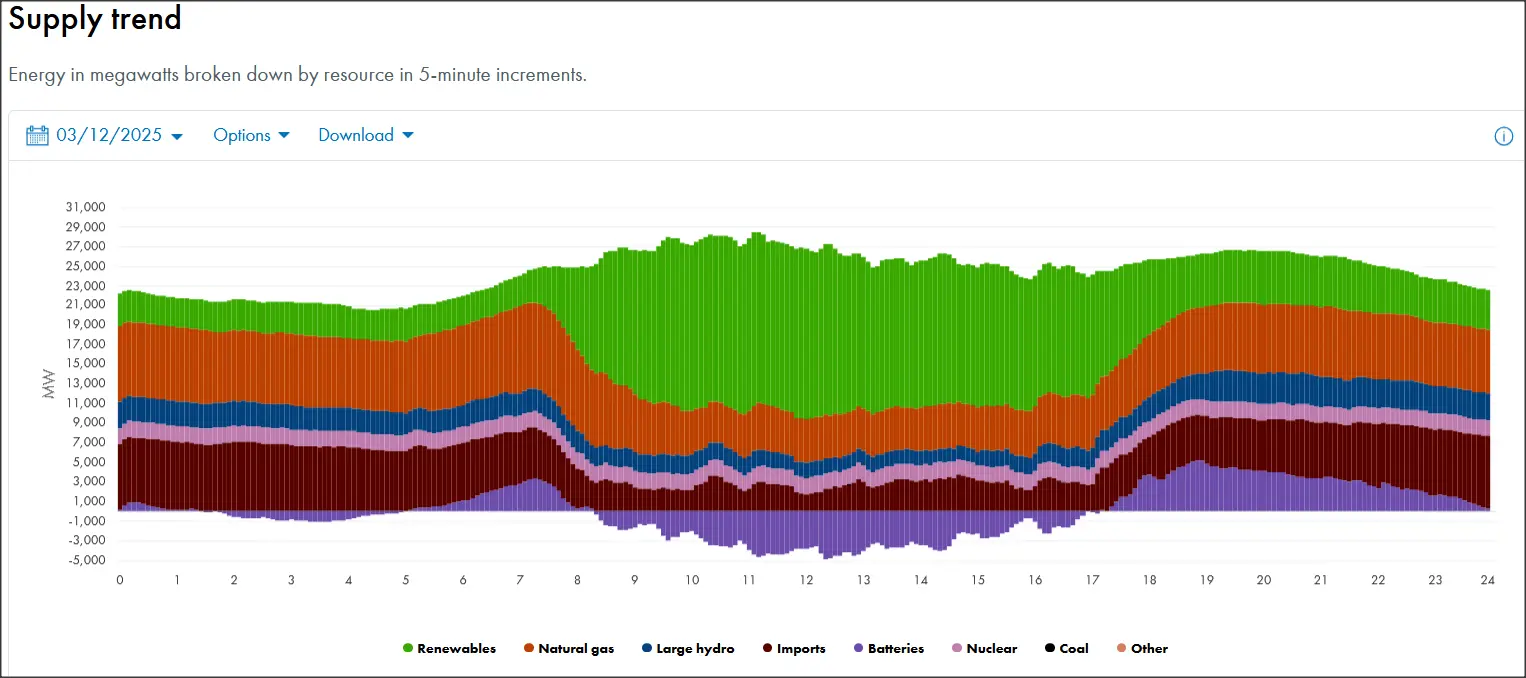
- “Zero emission” also only covers what comes out of the tailpipe while in use, with no tailpipe in the case of BEVs and tailpipes a portion to most of the time in the case of PHEVs. Actual operating emissions will depend on power into the grid, both by geography and by time of day, and this factor presents an inherent contradiction. For instance, purported cost saving estimates for ZEVs depend heavily on the assumption owners will recharge at night when the state’s rapidly growing electricity prices are at their lowest. Conversely, the associated grid emissions—along with ZEV operating emissions—are at their highest during this period, as illustrated below in Cal ISO’s supply tracking for March 12.
- On a well-to-wheel basis, production emissions for ZEVs are also substantially higher given their much greater materials use especially for the battery materials coming predominantly from imports. For example, Toyota officials have previously said that for the “. . . amount of materials we need for one electric-vehicle battery, we can build 90 hybrid batteries.” The exact break-even point depends on the vehicle models and modeling assumptions, but use of Department of Energy’s GREET model typically shows it takes about a year or more of driving before BEVs begin showing emissions savings over an ICE vehicle while other sources show a longer break-even period.
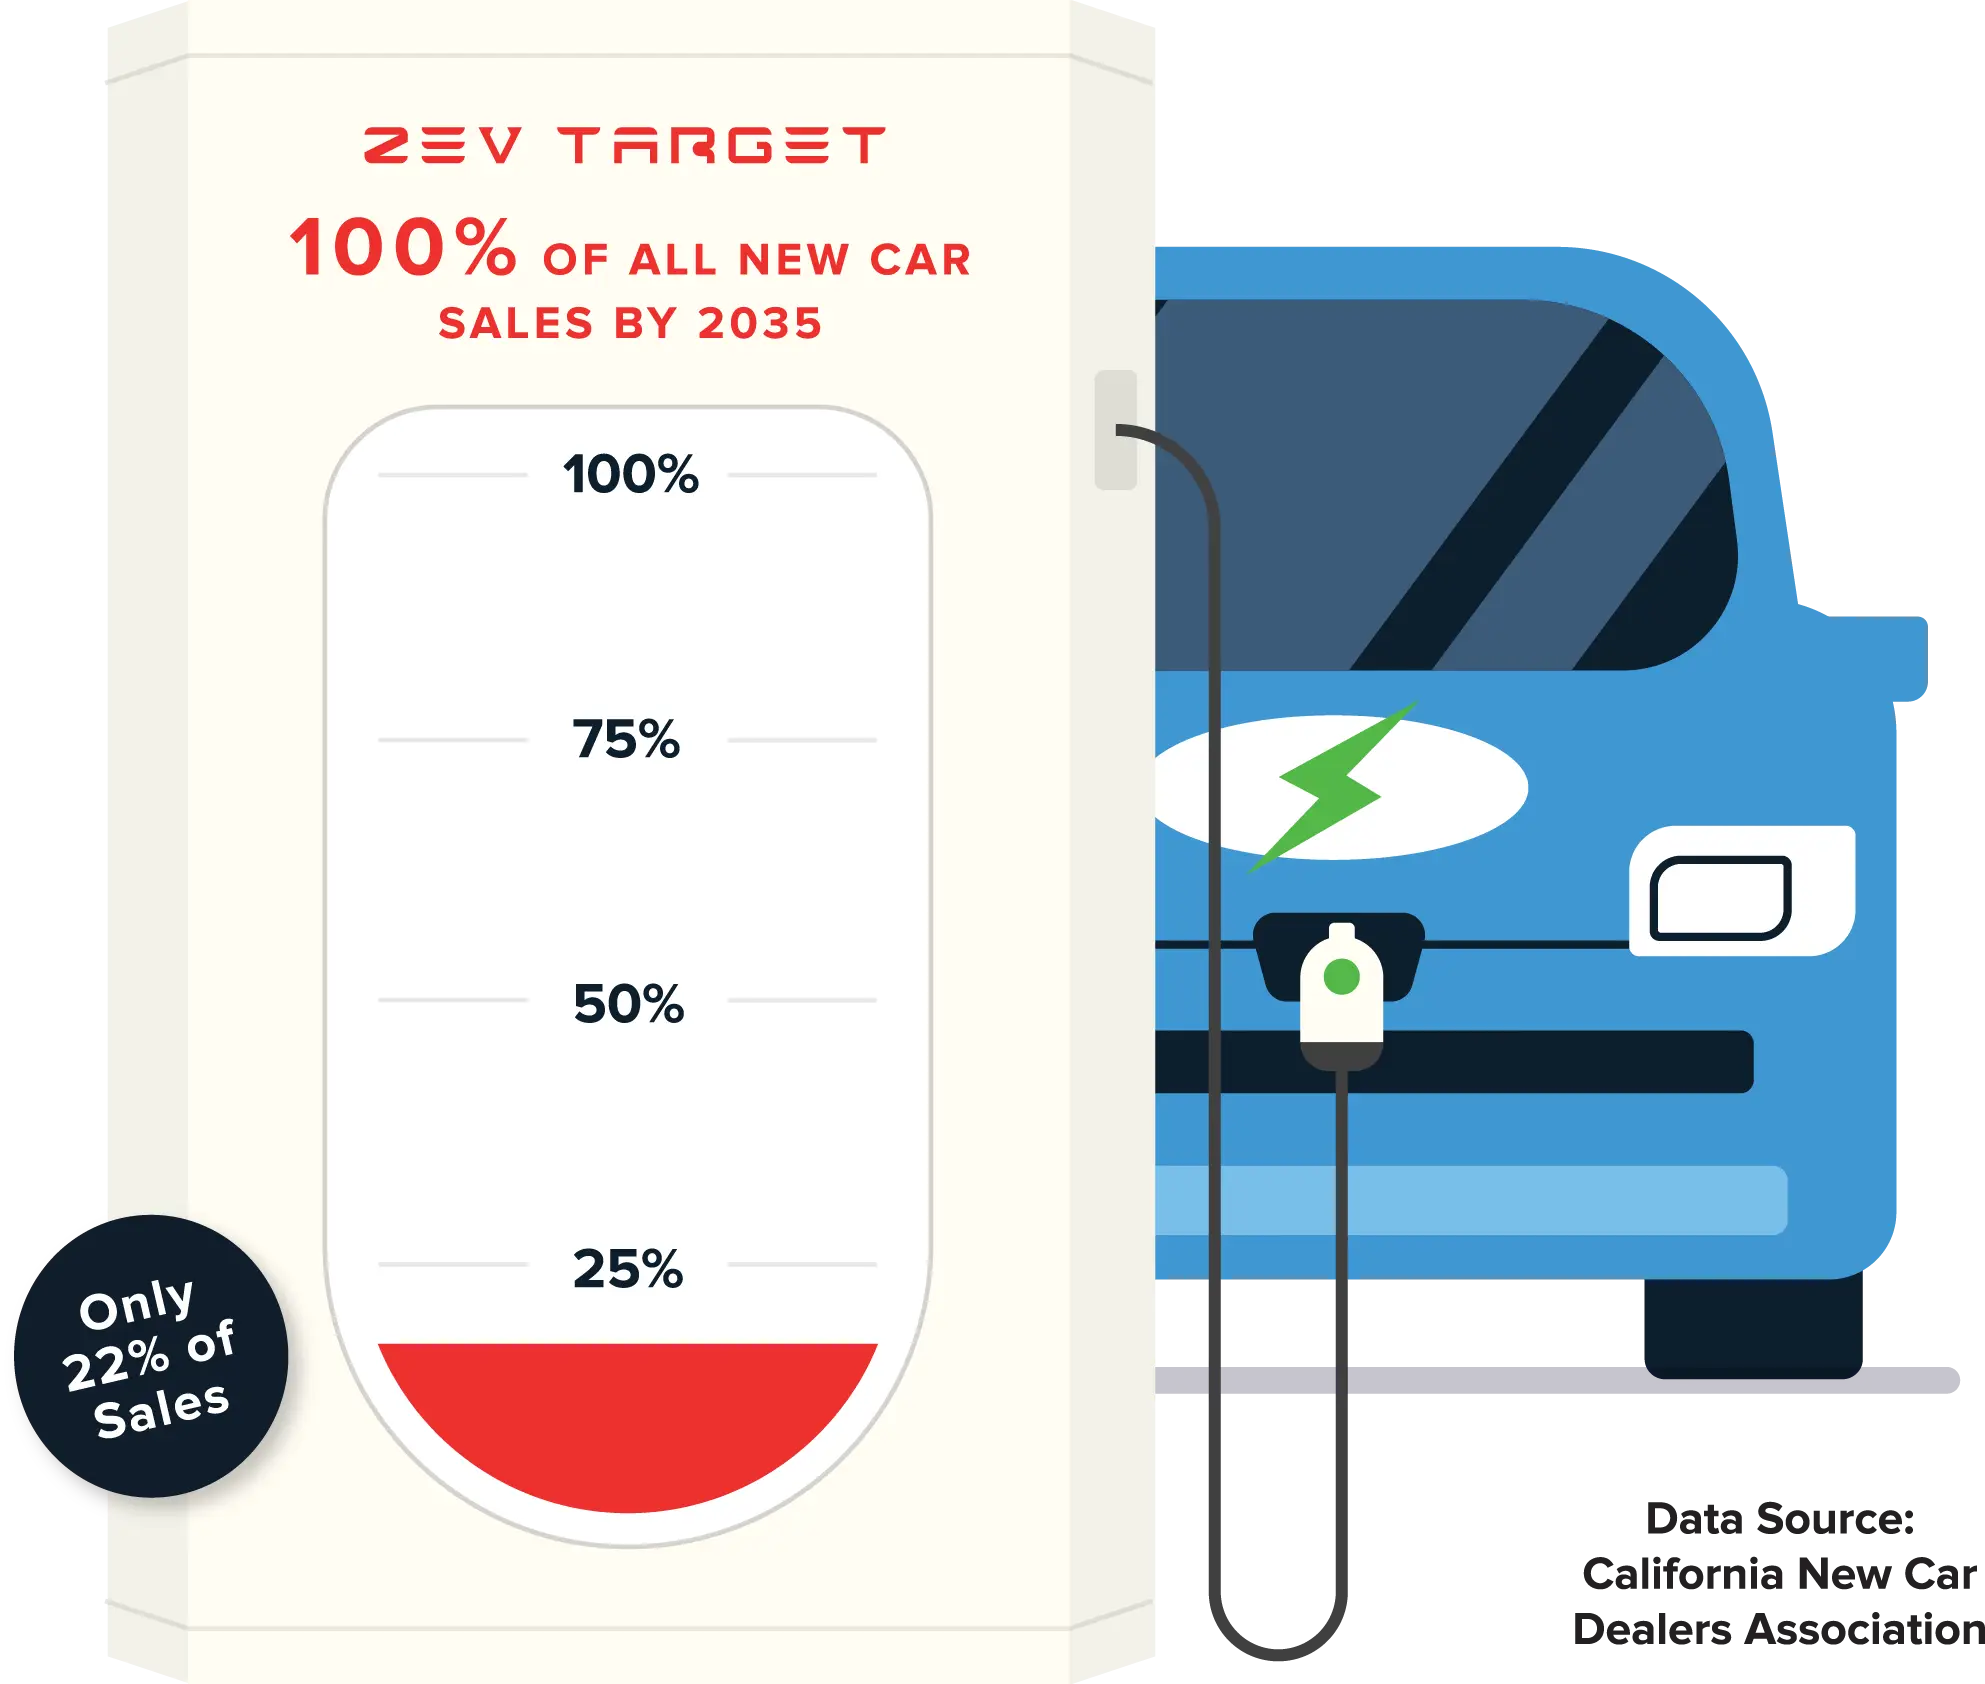
Considering these factors, vehicles being mandated under the Air Board rules are more appropriately considered lower emission rather than truly zero emission. In the interests of truth in disclosures, our tracking of progress under the Executive Order consequently has focused on the more zero component of the “zero emission” eligible family. In 2024, ZEVs as defined in the regulations averaged 25.5% of all LDV sales. The more truly zero BEVs were at 22%, as shown in the following charts. Hydrogen (primarily fuel cell) vehicles are also eligible to be classified as ZEVs, but only 600 were sold in the state in 2024.
Will the Numbers Change? Factors Affecting Sales
Why by no means comprehensive, some key factors affecting the level of future sales and whether the state can meet the governor’s sales mandates in 2026 and beyond include:
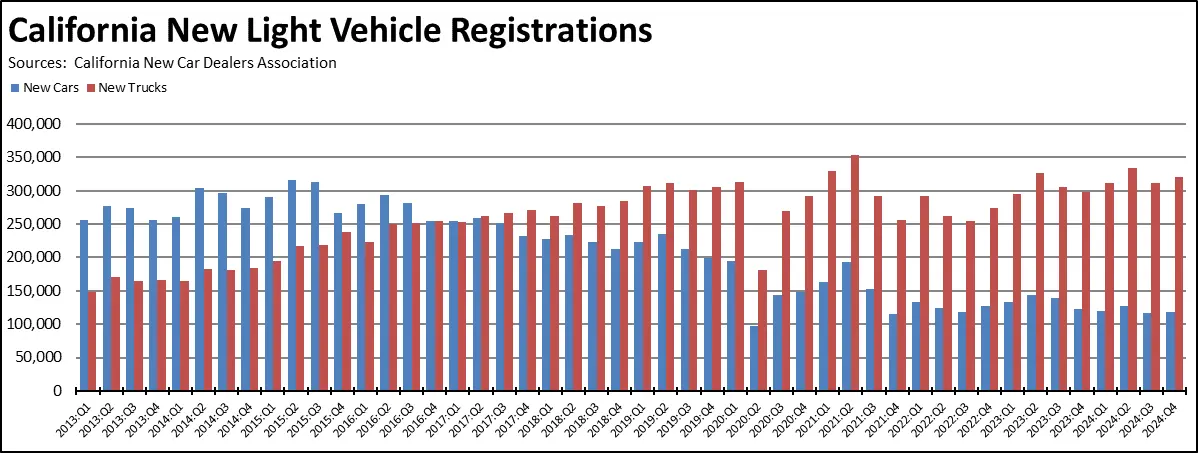
- Fewer Vehicle Sales Make the ZEV Numbers Look Better. The current market share numbers stem in large part from a reduced LDV sales base. The CNCDA data shows total LDV sales at 1.76 million in 2024, essentially unchanged from 2023 and 13% below the prior peak of 2.03 million in 2017 and 2018. CNCDA projections also expect 2025 sales to improve only marginally, to 1.80 million. The latest Consumer Confidence survey from the Conference Board further indicates a sharp drop in the number of households planning to purchase an automobile, from 13% at the end 2024 to just above 10% in the latest results for March.
Improvement in the market share metric in part depends on total sales continuing to be depressed. For example, the 448,168 ZEVs (PEVs) sold in California represent a 25.5% market share in 2024 when compared to a base of 1.76 million. At 2.03 million, the share either descends to 22.1% or an additional 63,000 ZEVs would have to be sold, an unlikely outcome given the sustained price premium for ZEVs and other factors as discussed below.
Even with the slippage, the current market share of ZEV sales consequently derives from the increasing unaffordability of new vehicles to Californians in general, a factor that continues to rise as the development costs and per vehicle losses associated with ZEVs have to be carried by a shrinking ICE/HEV component in the total sales base. For example, Ford—which is one of the few companies that discloses the results separately—has posted losses on their electric vehicle lines totaling $9.8 billion in 2023 and 2024, and prior to the pending round of tariffs was projecting additional losses of $5.5 billion in 2025. The 2024 loss is the equivalent of just over $52,000 per electric vehicle the company sold that year. These losses were only offset by profits generated from their traditional ICE model lines. - ZEV Prices Have Stopped Dropping in the Last 2 Years. Prices for new vehicles in general and ZEVs specifically remain high, limiting the overall potential market especially when adding in the continued high financing rates. The federal tax credits have added yet another uncertainty factor, with full credits more available through leasing than through sales, and the ZEV market has adjusted accordingly but with accompanying effects on the used market and declining residual/trade-in values for those who have chosen to buy.
![]()
Reflecting the shift in pricing required to fund the mandated transition to electric vehicles, the average transaction price of all vehicles has soared 24% since the end of per-pandemic 2019, with similar price increases of 19% (Small/Mid-size Pickup Truck) to 25% (Compact Car) in the lower cost vehicle classes tracked in the chart. Overall using the average transaction prices reported by Kelly Blue Book, the price differential between electric vehicles and all new light vehicles has remained relatively stable at an average $7,600 since 2023.
Prices are likely to remain high, further limiting access to the new vehicle market by income but in a perverse outcome also continuing to make the ZEV sales appear higher than they otherwise would be. Particularly in a component-short supply environment as represented by ZEV dependence on imported materials, producers will continue to prioritize production of higher price/higher margin vehicles to maintain overall profit levels and more critically to generate the cash flow required to support the costly shift to electric vehicles.
ICE sales also will continue to subsidize the transition to electric vehicles. This factor will tend to focus the market on higher price/higher margin offerings and reduce the supply at the lower end—reducing options immediately in the new car market but also with longer term implications to the used car market on which middle- and lower-income households are increasingly reliant. Increased offerings of lower price models may be an option in theory, but the reality under the governor’s sales mandate is that the ZEV sales requirement would only become higher.
- Importance of Tesla Sales. Current progressive angst over Elon Musk’s role in reforming federal spending to address the unsustainable deficit have led to some reports suggesting future Tesla sales may be affected. This outcome could affect future progress on the ZEV goals in any number of ways:
- Although its share is down from previous highs, Tesla is still fundamentally the ZEV market with 52.5% of California BEV sales in 2024. And these are full, zero tailpipe emission ZEVs and not the combustion engine PHEVs otherwise counted as such under the current bureaucratic legerdemain.
- Tesla is the primary supplier of emission credits to other producers, both to meet the federal CAFÉ fuel efficiency standards and for the ZEV regulations adopted by California and other states. Without these credits to provide an economic pressure valve, the current regulatory structure falls apart, with sales of ICE and HEV vehicles unilaterally capped, electric vehicles instead having to carry the full cost rise in higher prices, or more of this cost burden shifted onto the households choosing to stay with combustion vehicles. If Tesla doesn’t sell cars, it doesn’t create credits for other producers to use.
- Tesla’s Supercharger network is now the primary support infrastructure for public charging. While both state and federal funds are attempting to expand public charging networks, as with any other government effort to finance competitors to private businesses, success is measured by how many charging stations are built rather than by how many operate as they should. Failure rates remain high, leading to consumer frustrations that can further degrade progress on the governor’s ZEV mandate. A recent survey by Consumer Reports indicates that 21% of EV owners experienced problems when using a public charging network, with the results for specific networks ranging from 48% for the lowest ranked network to only 4% for Tesla and 5% for financially-challenged Rivian.
- The current vandalism of Tesla vehicles is likely to contribute further to the rise in insurance costs for electric vehicles that on average are already 44% higher. The higher repair costs for electric vehicles already translate into higher insurance premiums that eat into the presumed operating cost savings touted for ZEVs. These higher costs have also led some rental car companies, notably Hertz, to back away from previous ZEV commitments.
- Current Market Share a Waypoint or a Mid-Term Endpoint? The current market penetration of 25.5% may not be just a plateau, but may be close to the mid-term market potential given the current and pending slate of ZEV models. In the latest demographic data from Plug In America from their 2024 survey for California:
- 46.1% of ZEV-owning households have annual incomes of $101,000 to $250,000, while another 18.8% have incomes over $250,000. Using the 2023 American Community Survey microdata analyzed through IPUMS.org, households in the first income group are 32.5% of California, and those earning more than $250,000 are 17.3%.
- ZEV owners remain predominantly male. 70% are men, 25% female, and 5% other responses. This gender mix has shown little movement.
- There is a clear divide by race/ethnicity. Whites are 83% of owners (vs. 35% of population), and Asian/Pacific Islanders another 13.8% (16.5% of population). Only 9.6% are Latino (38% of population), and only 3.8% African-American (6% of population). Again using the IPUMS.org microdata, the non-Latino White portion of the market is leaving the state, comprising 58% of the 2.18 million Californians who moved to other states in 2021-2023 (as are African-Americans who made up a relatively higher 8% of those leaving the state). At just 15% of this migration, Latinos are more likely to stay but are not buying ZEVs.
- California’s housing conditions are another limiting factor: 89% of ZEV owners also own their own home, while only 11% are renters; 81.4% live in a single family home that is more likely to accommodate in-home chargers, while the remaining 18.6% live in multi-unit housing with fewer opportunities for this option.
- Consumers Prefer Vehicles ZEV Makers Have Yet to Produce. Electric vehicles have yet to fully crack the defined preference for light trucks. In 2024, light trucks were 72.7% of California sales, and 83.5% nationally. While current models include several that are (higher priced) small SUVs and crossovers, a successful pick-up and larger SUV introduction are still missing elements. Owner complaints with current model options including loss of range under load has led some producers such as Ford to consider adding yet another acronym to the ZEV family, gasoline extended-range electric powertrains (EREVs), that are in essence a reverse hybrid that adds an ICE component generating electricity to electric powertrains. While the CARB regulations in essence allow for 80% BEVs and 20% hybrids, this distribution runs in reverse from clearly defined consumer preferences. It will continue to be limiting factor on the potential success of the governor’s sales mandate.
- ZEV Sales Remain Concentrated in Coastal Regions. In order to attain the governor’s sales mandates, ZEV sales would need to expand geographically far faster than they have. The following charts use legislative districts to illustrate the extent to which ZEV sales have failed to expand beyond their past sales base. In both cases, location quotients (LQs) for 2022 and 2024 are used to identify any shifts in relative sales concentrations, calculated as:
share of BEVs sold / share of population.
- A resulting location quotient greater than 1 means the sales are more heavily concentrated in the district (in 2024, 32 of the Assembly and 15 of the Senate Districts). A location quotient less than 1 means they are less. The sales numbers are estimated using the Energy Commission data. The population numbers are taken from the Center’s data series.
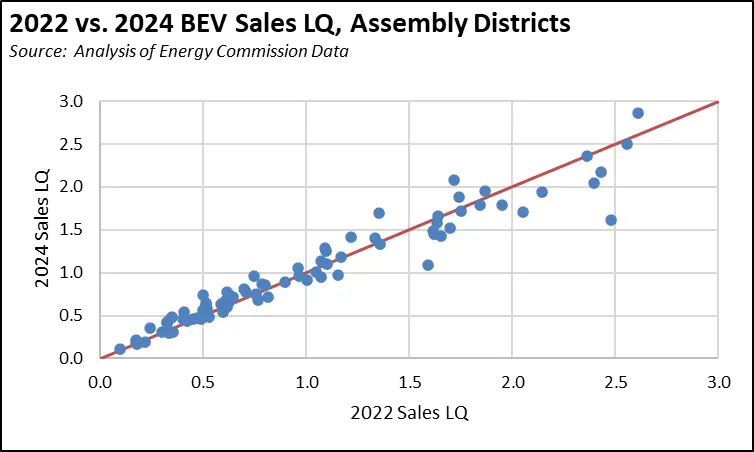
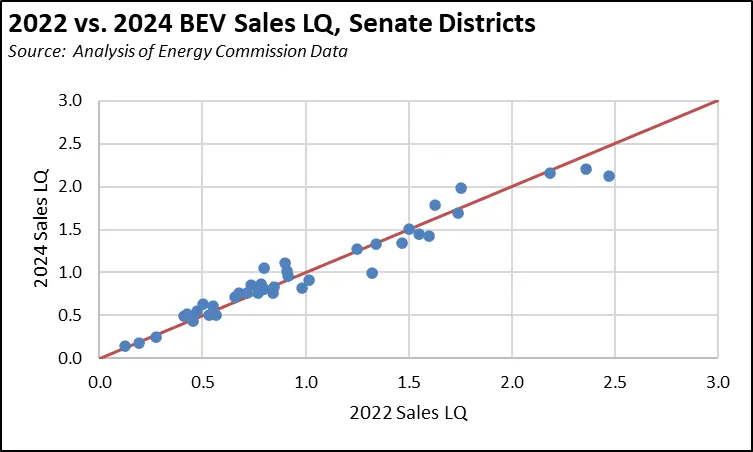
In both charts, districts lying above the red line indicate where relative sales have increased, those below where sales have receded, and is the case for the preponderance of districts, those on or near the line where there has been little change. The more granular Assembly Districts show some changes in the higher sale districts in 2024, but with sales constrictions outweighing those showing some growth.
ZEV Mandate Relies on California Fuel Prices Remaining High
California’s soaring electricity costs have steadily eroded the economic case for the governor’s sales mandate. With ZEV prices remaining well above the overall cost of ICE vehicles, supporters have instead relied on the proposition that ZEVs are less costly to operate in the longer run. Under this justification, high purchase costs can be otherwise offset and more by savings on fuels/recharging and by annual maintenance and repairs. Putting aside the differential ability of consumers to afford paying for 7 to 10 years of projected savings up front, this life-cycle cost comparison has been the primary factor enabling the Air Board to conclude there are low cost impacts from their rules on consumers.
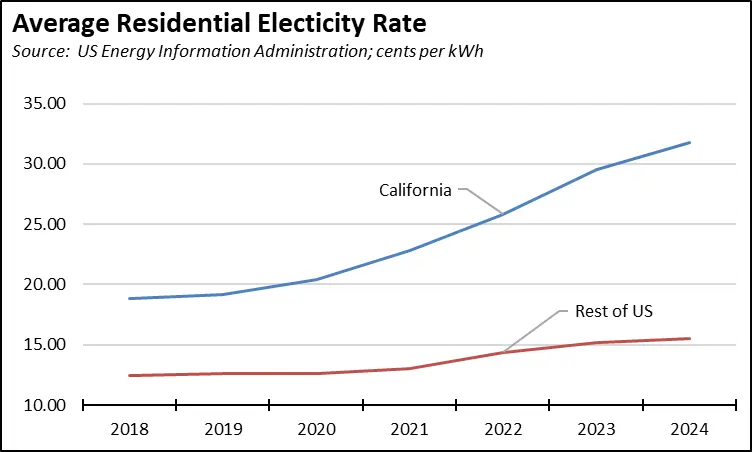
The operating cost advantage is receding rapidly. Between 2018 and 2024, the average residential electricity price soared 69% in California, nearly three times as fast as the 25% rise posted by the other states. The compensating factor, however, from the ZEV perspective is California’s equally high gasoline costs. In this period, the average California price taken from GasBuddy.com data rose 34% to $4.76 a gallon compared to a 2024 price of $3.21 in the other states. The California difference comes from the state’s unique fuel regulations and its much higher taxes and fees. In the most recent results for February, 32% of the average cost of gasoline came from taxes and fees, plus the ever-present volatility factor due to the state’s regulatory isolation of its fuel markets from the rest of the US and the world. This additional cost component borne only by consumers in California has dampened the otherwise disincentive effect from rising electricity costs on the ZEV market.
The relative importance of high gasoline prices to the success of the regulations can be illustrated by comparing the best-selling models from the CNCDA report. In the chart below, fuel/recharging costs are compared using the highest sales BEV and ICE under each market segment, as well as HEVs where this model option is available in the 5 top sellers. The calculations are done through the following steps:
- Annual costs are based on 12,500 miles of driving using the efficiency standards from the 2025 US EPA ratings. Where more than one model option is available, the most popular one listed by Edmunds.com is used as the base or, if not available, taken as an average. In contrast to ICE models, the BEV efficiency ratings (along with estimated driving ranges), however, are generally acknowledged as being inflated compared to real-world driving conditions. While Tesla models have been shown to more closely match the EPA ratings, other company models are adjusted in the calculations to reflect the average difference found in a recent study.
- Average 2024 gasoline prices are taken from the GasBuddy.com data. Electricity prices are from the 2024 average California residential price. Rather than night-time rates often used in comparisons of this type, the average rate is applied for the following reasons:
- Assuming ZEV sales expand in accordance with the governor’s sales mandate, recharging will become more variable with greater use of higher-cost public charging networks, charging at workplaces, and other adjustments. For example, Tesla Supercharger rates in April 2024 in Sacramento ranged from 18 to 52 cents per kWh depending in large part on recharging speed and time of day plus additional fees depending on congestion factors.
- Night-time recharging is now generally available to current ZEV owners, which the previous demographics show are predominantly higher income households owning their own homes and specifically single-family homes capable of containing in-home charging. Assuming sales proceed in accordance with the sales mandate, this option will not always be available especially for renters with fewer installation opportunities and instances where landlords will have to contend with higher insurance costs related to the attendant liability risks. Using the most recent 2023 American Housing Survey, 85% of housing units in California have a garage or carport, but not all are currently served by electricity and garages continue to be repurposed as Accessory Dwelling Units (ADUs) as the one successful housing supply reform enacted by the state to date.
- The combined average rate for residential and commercial users in 2024 was 28.1 cents, or nearly equal to the residential rate alone if a markup is included for commercial sales.
These assumptions provide the base numbers shown in the following chart as the cost difference of driving a BEV vs. the comparison ICE/HEV, but as with any analysis of this type, the actual results may vary. ZEV owners have some degree of control over their costs by shifting when and how they recharge, as do ICE owners such as by delaying a refill during price increases or getting in line at the local Costco. The numbers will also vary depending on which models and model configurations are being compared, along with actual driving conditions including wind, speed, terrain, loads, and for ZEVs, ambient temperatures. These added specifics, however, will only shift the numbers and not their relative scales as shown in the chart.
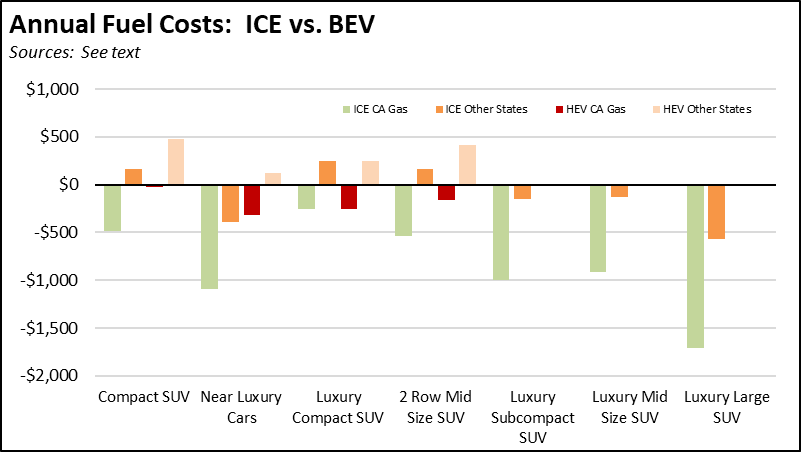
From the chart:
- Based on the assumptions, BEVs still cost less to fuel than ICEs, but at potential savings ranging from only $250 a year to $1,700, with the spread narrowing not only because of electricity costs but also increased fuel efficiency for many ICE models using technology spurred by the development of ZEVs and HEVs. Using the current $7,600 price premium for electric vehicles, these results suggest a payback period of 4.5 to 30 years in the decision to buy a ZEV based on fuel costs alone.
- These results (green bars in the charts) are based on California gasoline prices. If instead the state removed its high regulatory and tax/fee additions and allowed prices to fall to the general market represented by the other states, the ZEV price advantage (dark orange bars) nearly vanishes or shifts over in favor of buying an ICE instead. Under California’s current electricity price trends, buying a ZEV only makes economic sense as long as the state keeps gasoline prices high as well. And whether intentionally or not, current de facto California policy is to keep gasoline prices rising in the future including annual increases in the excise tax, pending low-carbon fuel regulations increasing costs by another $1.30 by 2035, increases in cap-and-trade originally proposed in regulation but now proposed by the governor’s Budget to do through legislation this year, and an expected 10-cent increase as the result of last year’s ABX2-1.
- Consumers instead choosing to buy a HEV—as increasing numbers are doing—also can reduce the fuel cost difference to marginal or negligible levels (red bars). If instead state gasoline prices were in line with the other states (light orange bars), HEVs would be cheaper to operate than a BEV. Note there are no HEV options in the last two market segments.
Other cost benefits presumed for ZEVs are also turning out to be less than originally presumed:
- ZEVs generally require less maintenance than ICEs, but the cost savings are falling short of their expected levels. In the most recent Consumer Reports vehicle reliability results, although improving, PHEVs still had 70% more problems than gasoline and HEV vehicles, and electric vehicles had 40% more. Reliability is likely to improve as model families age and production and engineering bugs are identified and resolved as with any vehicle, but Consumer Reports still tags HEVs as the most reliable of the current electric offerings.
- The extended warranties required in the regulations cover much of these potential costs as well. Customers are still paying, they are just doing it through higher up-front payments covering the cost of these warranties rather than as issues arise. When ZEV repairs are required, they are costing more than for ICEs. As indicated earlier, this factor was key in the decision by Hertz to sell off its ZEV fleet of cars. Insurance rates are also consequently rising, further decreasing the presumed operating cost advantages for ZEVs.
- Federal tax credits were intended to help bridge the cost gap for ZEVs. Even if they do survive in some modified form, their effective impact has been minor in practice. The credits are income-limited, meaning they are less available to the primary buyers of ZEVs. There are further limitations based on vehicle and battery content, and these restrictions have severely limited which models are eligible for full credits. Finally, they are tax credits, and can only be charged against potential tax liability and do not carry over. Compared to the potential maximum credit of $7,500, IRS data shows the average federal tax liability for Californians was $8,273 for tax filings with AGI of $75,000 to $100,000 (meaning many in this class likely paid less than $7,500), and the tax liability for the next 4 lower AGI ranges was only $198 to $4,679. Pending federal tax reform likely will reduce these amounts further.
- Rather than reducing prices, subsidies of this type also tend to elevate the price producers can charge, an outcome clearly indicated during the Congressional debates on this legislation as ZEV producers frequently modified their pricing in response to the then-current credit levels as they changed. Tax credits not so much help bridge a price gap as help to sustain it.