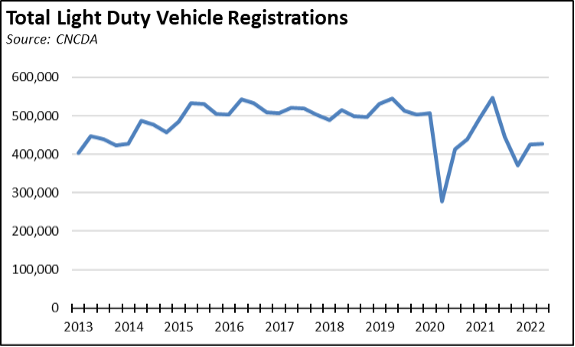
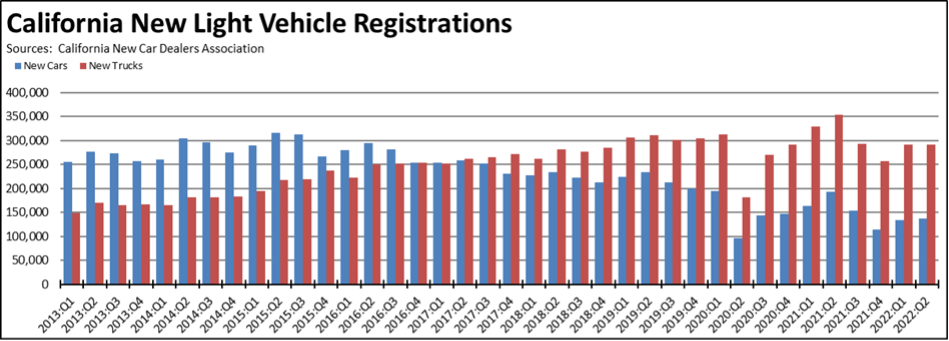
In the latest report from California New Car Dealers Association (CNCDA), total new light-duty vehicle registrations in the second quarter of 2022 were largely unchanged from the first quarter, but were off 17.5% from the same period in 2021, and down roughly the same compared to the same quarter in pre-pandemic 2019. Total sales for the year are now expected to be just slightly below the 1.86 million seen in 2021. The limiting factor continues to be constrained production levels and dealer inventory.

Light Trucks Continue to Dominate New Vehicle Sales
In California, light trucks were little changed at 68.4% of total sales in Q2 2022. Truck sales in the rest of the US also were little changed at 80.4% for the quarter, likely indicating a continuing redirection of limited production capacity to these higher margin vehicles. While sedans and smaller cars still present somewhat higher potential in California compared to the other states, the future of electric vehicles beyond this state remains tied to a much greater extent to vehicles such as Tesla’s Model Y and Model X and Ford’s Mustang Mach-E and F-150 Lightning than it does to offerings such as the revamped Chevy Bolt.

Average New Vehicle Price Breaks $48,000 Barrier; Average Electric Vehicle Price Just Short of $67,000
In the latest numbers from Kelley Blue Book, the average transaction price nationally for new vehicles rose again in June to $48,043, breaking the $48,000 barrier for the first time and rising 12.7% over the year. Electric Vehicles rose faster at 13.7% to $66,997, while Hybrid/Alternative Energy Cars again saw the highest increase of 27.6% to $39,040.
Source: Kelly Blue Book; selected categories
The rising average cost of new vehicles in part reflects the shift of production capacity to the higher priced/higher margin vehicles and greater incidence of higher income buyers compared to the pre-pandemic market. This trend, however, also has longer term implications to the broader vehicle market, as limited new vehicle supply since 2020 and rising prices exert upward cost pressures on the used vehicle component as well.
This situation is also reflected in the more elevated price and price acceleration points for electric vehicles. The various iterations of the ZEV regulations have been based on the premise that over time advances in battery technology would see a cost convergence between these vehicles and internal combustion engines at least on a life-cycle basis. The current version as being developed in the Air Resources Board Scoping Plan and Advanced Clean Car II regulations even goes so far as to codify this aspirational assumption by eliminating competing consumer options that could prove it wrong altogether. But the current trend—driven in part by rapidly rising battery metals prices and looming materials supply shortages—has been in the opposite direction, with electric vehicle prices rising more rapidly than the overall market average.
As an indication of how far the price break still needs to fall for electric vehicles to become more broadly affordable, Subcompacts averaged $23,009, and Compacts averaged $26,211, or roughly up to one-third the cost of an average electric vehicle. Hybrids and other alternative fuel vehicles still remain a more cost effective option—as shown above and as indicated below under consumer purchase choices—capable of achieving a substantial portion of the targeted emission reductions at lower cost to households and businesses. State policy as being developed in the Air Resources Board Scoping Plan and ACC II rules instead continues to focus on limiting purchase options and state-funded refueling infrastructure to essentially a single technology, electric, with only minimal provisions for fuel cells should battery technology, battery materials supply, and the required expansion of grid capacity end up not cooperating with the agencies’ hopes and assumptions.
As indicated in the sales numbers below, there is a clear market role for electric vehicles. In fact, the top two selling models in the first half of 2022 were the Tesla Model Y at 42,320 units and Tesla Model 3 at 38,992. But after a year and a half of frequent price increases, Edmunds shows the Model Y with an MSRP of $67,190 to $71,190 and the Model 3 at $48,190 to $64,190. The electric vehicle market is there but it has yet to spread to the broader range of price points essential to the ability of the current Air Board rulemaking to result in technology replacement rather than shifting vehicle ownership more to luxury good status much as other state policies have done so in respect to essentials such as home ownership and now threaten to do as well in areas such as electricity consumption and affordability.
Price increases have not been limited to Tesla. Other electric producers have raised prices as well, in part to recover profit margins eroded by rising battery material costs but also because the recent period of high gasoline prices created a window of pricing opportunity.
The recently passed but inaptly named “Inflation Reduction Act” attempts to counter this trend in part by revisions to the current federal tax credits into the new Clean Vehicle Credit. On one hand, the new credit is expanded by removing the previous sales cap already passed by Tesla, GM, and Toyota. On the other, eligibility for the credit and its amount are now subject to a large range of additional factors including where the vehicles are assembled, where the battery materials are sourced, vehicle prices, and household income and these factors change over time. Consequently, while intended to promote electric vehicle sales, the credit as now constituted likely applies to only 11 of the 72 models currently sold in the US. These provisions likely will also disadvantage smaller companies such as Rivian which do not have the financial wherewithal or current sales to compete in contracts for limited long-term battery material supplies besides Tesla, Ford, GM, and other large producers in order to comply with these provisions of the revised credit.
Rather than a temporary measure required to jump start the electric vehicle market—as originally promoted—these credits as revised are now moving to become a permanent feature of vehicle pricing, as evidenced by removal of the sales cap and extension of the revised credit to used electric vehicle sales as well. But the history of public subsidies has not been one where they have been effective in bringing prices down. Instead, producers have priced to the subsidies and kept prices well above where they otherwise would be. One of the clearest examples in this respect has been the federal student loan program, where the rapid expansion of easy credit created the conditions which colleges and universities matched with equally rapid rises in the cost of tuition and fees.
For example, the day after legislation containing the revised credit passed the Senate, Ford announced price increases for the F-150 that basically nullified its potential effect, adding $6,000 to $8,000 across the line depending on configuration including $7,000 for the entry-level package. Ford justified the price hikes based on rising materials costs, and from this perspective, they are in the same range as similar earlier moves by Tesla and by GM on the Hummer (which will not qualify under the new credits). Ford has also been one of the most aggressive producers seeking to move into electric vehicles while generating a profit, including major cost reduction actions such as layoffs of 8,000 workers and producing the Mustang Mach-E in Mexico in order to reduce labor costs. The size of the price hikes and their timing, however, illustrate the point that public subsidies will be limited in their ability to close the gap between electric and traditional fuel vehicles. They are just as likely to define the range of the permissible as producers seek to cover the costs of this production shift, either directly on their electric offerings or indirectly through pricing on the remainder of their lines.
As discussed in a special report released by the Center this week and in our previous report on telecommuting, vehicle ownership is highly associated with the ability of households to rise above poverty and improve their economic status. Even in the state’s most transit-dense area (San Francisco-Oakland), workers commuting 30 minutes can access 8 times as many jobs by car as they can by public transit. In Los Angeles-Orange Counties, the number is 32 times as many jobs, in San Jose 42 times, in Sacramento 51 times, in San Diego 53 times, and in the Inland Empire 91 times as many. This household economic imperative was reflected in declining public transit use even prior to the pandemic. The collapse of ridership during the pandemic combined with the steep rise in demand for used vehicles indicates that for many households, vehicle ownership became a matter of economic survival.
As discussed in previous quarters in this report, the shift to a 100% electric sales mandate currently faces a number of challenges including China’s dominance in the processing of battery critical materials, expected global supply shortages for these materials as other nations and states adopt similar mandates, the need to expand recharging capacity as well as grid capacity to feed it, and the consequent risks of rising prices that by limiting what vehicles can be sold would reduce vehicle ownership in the future to only those who can afford them. As indicated in the Center’s special report this week, the legislature acknowledged the economic importance of vehicle ownership to jobs and household incomes by making it possible for undocumented persons in the state to obtain a California driver’s license. The agencies in the current rulemakings have yet to justify how the focus on a singular technology will result in vehicles they can afford.
The agencies also have yet to detail how the current rulemakings will result in vehicles that workers will be able to use. The rulemaking process is being driven by numbers as is the case with any bureaucratic process. Rather than a market-driven roll-out much as Tesla and models such as the F-150 appear to have achieved, the 100% sales mandate focuses on the target number and instead relies on assumptions that the necessary materials supply will somehow develop—a point that the Draft EIR for the Scoping Plan fully punts on—and also requires that substantial public funds be used to create the necessary charging infrastructure. Consequently, the agencies now track the number of charging stations that are being built. Less consideration appears to be given to making sure they work. An earlier UC Berkely report this year found that 27% of the charging stations in the Bay Area were not working properly. A more recent J. D. Power survey just found that a fifth of motorists nationally were unable to recharge their vehicles at public stations, with nearly three-quarters indicating that faulty equipment was to blame.
ZEV Sales Up 62.4% from 2021: Q1
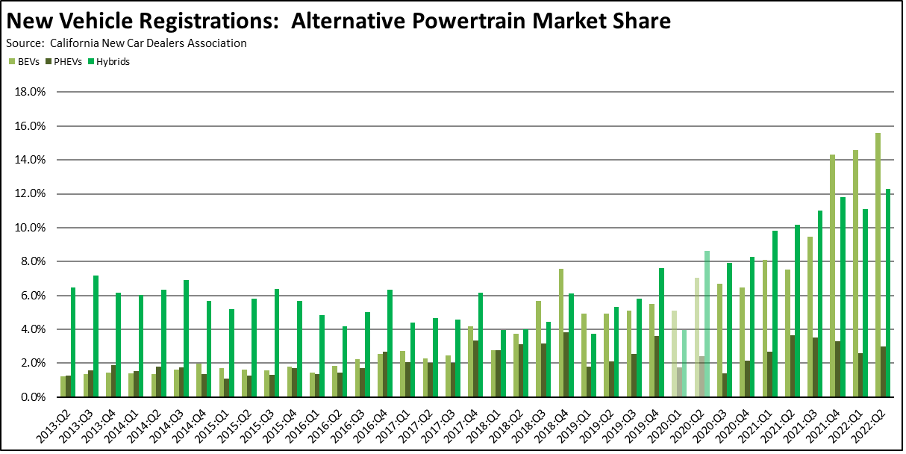
New registrations of battery vehicles were up in the 2nd quarter, again largely on the strength of Tesla sales. Sales of true ZEVs (battery electric vehicles—BEVs) rose 62.4% over the year. The more volatile combustion engine component—plug-in hybrids (PHEV)—used to elevate the official numbers tracking ZEV adoption were down 35.6%. Battery hybrids (HEVs) were down 5.3%, although this dip appears to have come more from production limits as high gasoline prices meant buyers were looking for more fuel-efficient vehicles in this period. From the separate Energy Commission sales data, hydrogen vehicles contributed only 713 to the total true ZEV numbers.
Market share for BEVs was up slightly from the previous quarter at 15.6%. As has been the case since the first half of 2020, use of market share as a metric tends to overstate the situation as overall sales volume has been about 20% below previous levels. Measured against a more normal level of sales, BEVs instead would come in with a market share in the 11 – 13% range, still an improvement but lower against a broader market with a greater offering of lower price models rather than the current tilt toward higher priced vehicles closer to the BEV range.

While BEV sales were up, they continued to be concentrated in the coastal urban centers rather than the lower income interior regions. Using the Energy Commission ZEV sales data, the Bay Area with only 19.4% of the population accounted for 29.2% of total BEV sales in the first half of 2022. Orange County had the second highest concentration, with 12.7% of sales compared to 8.1% of the population. Los Angeles was only slightly above at 29.7% of sales vs. 28.4% of the population.
Source: Energy Commission
State Goal: 100% ZEVs by 2035
The state previously maintained a goal of 5 million zero-emission vehicles (ZEVs) on California roads by 2030 pursuant to Executive Order B-48-18. Under Executive Order N-79-20, the governor changed this goal to require all new vehicles offered for sale in the state to be ZEVs by 2035 for light duty cars and trucks, and by 2045 for heavy and medium duty vehicles. In spite of the substantial but as-yet unknown costs and other effects of this action including as discussed in prior reports the availability of the required battery and related materials, the state agencies are now moving ahead to implement this order administratively using the blanket authorities given to them by the legislature under the climate change program.
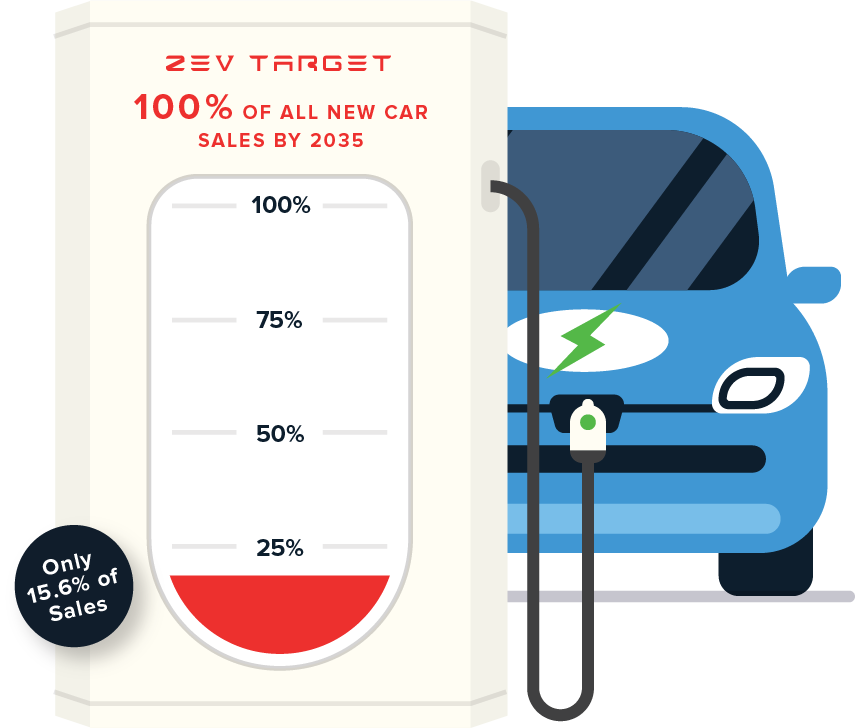
California’s sales mandates for ZEVs first began with the Air Board’s adoption of the LEV I regulations in 1990. After four decades, these mandates have resulted in ZEVs comprising 15.6% of new light vehicle registrations in the second quarter of 2022.

