Below are the monthly updates from the most current December 2025 fuel price data (GasBuddy.com) and October 2025 electricity and natural gas price data (US Energy Information Administration). To view additional data and analysis related to the California economy visit our website at www.centerforjobs.org/ca.
California’s energy cost rankings again generally remained unchanged even with the changeover to the less costly and higher supply producing winter formulations for fuels. As in the past few months, the average electricity bill rank again showed marginal improvement as costs continued to rise elsewhere in the country as the result of fall and winter weather combined with factors such as natural gas pipeline restrictions in some states.
Inflation
Due to the federal budget impasse, data for the CPI was not collected in October, affecting the calculations for the September California CPI. This data will be updated as the federal data continues to resume.
California Gasoline Taxes & Fees
Gallon of Gasoline
As discussed in prior reports, the Energy Commission has not updated their fuel tax and fee calculations since March 2025, and in spite of arguing that they required the data to properly monitor fuel pricing through SB 1322 (2022), has not updated their fuel net margin analysis since March 2024. In the absence of current Energy Commission data, we are making our own estimates using the Commission factors and the new OPIS data. In December, $1.42 (32.8%) of the price of a gallon of regular gasoline was paid to cover state, local, and federal taxes and fees.
California Carbon Taxes: LCFS and Cap & Trade
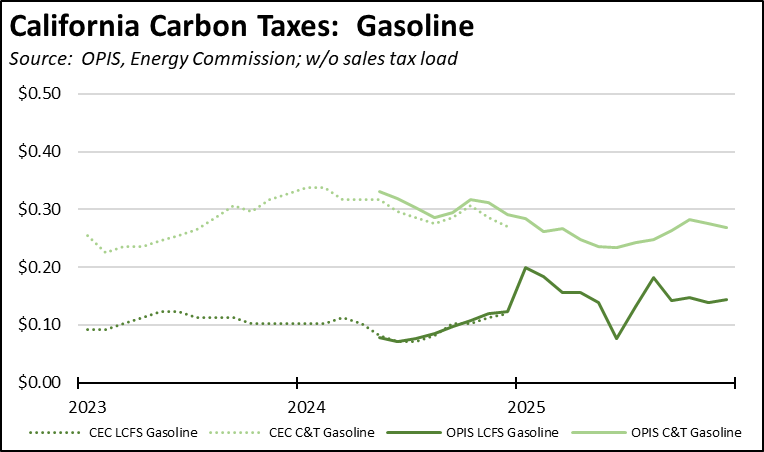
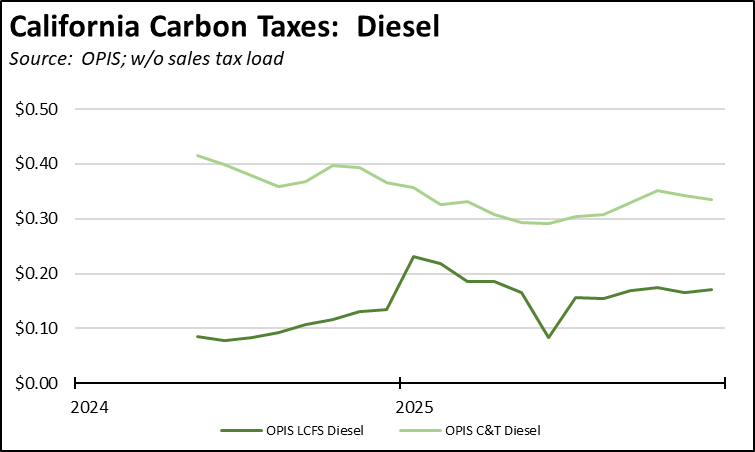
In December, total LCFS charges incorporated in the price Californians pay for fuel rose 1 cent for gasoline but were unchanged for diesel, while the Cap & Trade component showed a 1 cent improvement for both. Combined charges for both fuels were unchanged. The costs shown in the table are for the penultimate month-to-date numbers from the OPIS Carbon Market Report, adjusted to incorporate state and local sales tax to account for the full additional costs imposed by these regulatory fees on fuel buyers. Certain Data or Information Provided By: Oil Price Information Service, LLC. Distribution of OPIS data without permission from OPIS is prohibited.
Combining the OPIS data (without the sales tax component) with the previous Energy Commission estimates, both charges have shown relative stability in the past few months. Note that both charts include both the Cap & Trade components charged at the rack and levied on production from the OPIS data, and only the rack component in the Energy Commission data.
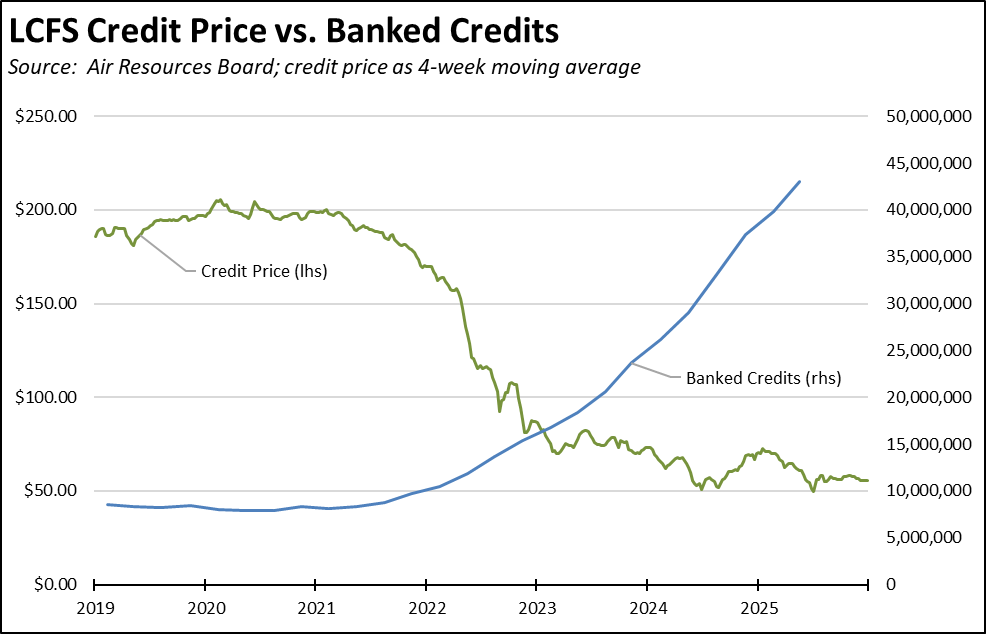
The cost effect of the amended LCFS regulations continues to be moderated by the high level of banked credits. Overall, credit prices have been largely level, showing only a marginal change since the end of July on a 4-week moving average basis, with trade volumes and prices moderated further by the shift to winter formulation. This price moderation and the resulting stable impact on fuel prices stem from the continued run-up in banked credits, which reached their highest level yet of 43.0 million in the 2nd quarter just prior to the effective date of the amended regulations. As the increasingly stricter standards under the amended regulations begin to eat away at this buffer, credit prices and the consequent costs to households and employers will begin trending back up towards historical levels.
In the most recent auction of Cap & Trade credits held November 19, all credits offered by CARB were sold, resulting in proceeds of $844.2 million. To date, the auctions have had total proceeds—ultimately paid by California households and employers—of $1.7 billion in the fiscal year.
California vs. Rest of US Diesel Price
Above Other States
(CA Average)
The December average price per gallon of diesel in California eased 18 cents from November to $4.97. The California regulatory and tax premium above the average for the US other than California ($3.51) eased to $1.47, a 41.8% difference.
price
In December, California had the highest diesel price among the contiguous states and DC.
Range Between Highest and Lowest Prices by Region
above Other States
(Central Sierra Region)
The cost premium above the US (other than California) average price for regular gasoline ranged from $1.44 in the Central Valley Region (average December price of $4.20), to $1.75 in San Diego/Imperial Region (average December price of $4.51).
Highest/Lowest Fuel Prices by Legislative District:
California Residential Electricity Price
Rest of US
California average Residential Price for the 12 months ended October 2025 was 32.04 cents/kWh, 96.7% higher than the US average of 16.29 cents/kWh for all states other than California. California’s residential prices were the highest among the contiguous states and DC.
California Residential Electric Bill
For the 12 months ended October 2025, the average annual Residential electricity bill in California was $1,876, or 88.7% higher ($882) than the comparable bill in 2010 (the year the AB 32 implementation began with the Early Action items). In this same period, the average US (less CA) electricity bill for all the other states grew only 31.3% ($427).
In 2010, California had the 9th lowest residential electricity bill among the contiguous states and DC. In the latest data as portions of the nation experienced higher winter costs, it tied with Delaware for the 16th highest.
Residential bills, however, vary widely by region. Transforming the 2022 data from the Energy Commission, estimated annual household usage is as much as 82% higher in the interior regions compared to the milder climate coastal areas, and substantially higher when comparing across counties.
Rest of US
For the 12 months ended October 2025, California’s higher electricity prices translated into Residential ratepayers paying $13.1 billion more than the average ratepayers elsewhere in the US using the same amount of energy. Compared to the lowest cost state, California households paid $17.0 billion more.
California Commercial Electricity Price
Rest of US
California average Commercial Price for the 12 months ended October 2025 was 25.81 cents/kWh, 109.8% higher than the US average of 12.30 cents/kWh for all states other than California. California’s commercial prices were the highest among the contiguous states and DC.
California Industrial Electricity Price
Rest of US
California average Industrial Price for the 12 months ended October 2025 was 21.64 cents/kWh, 171.9% higher than the US average of 7.96 cents/kWh for all states other than California. California’s industrial prices were the highest among the contiguous states and DC.
Rest of US
For the 12 months ended October 2025, California’s higher electricity prices translated into Commercial & Industrial ratepayers paying $21.2 billion more than ratepayers elsewhere in the US using the same amount of energy. Compared to the lowest rate states, Commercial & Industrial ratepayers paid $27.6 billion more.
California Natural Gas Prices
Average prices ($ per thousand cubic feet; 12-month moving average) for the 12 months ended October 2025 and changes from the previous 12-month period for each end user: