Below are the monthly updates from the most current July 2021 fuel price data (GasBuddy.com) and May 2021 electricity and natural gas price data (US Energy Information Administration).
Inflation Rising
in California CPI,
May 2021
Overall inflationary pressures have been rising rapidly since the beginning of the year as the result of continuing supply and labor disruptions affecting the production and availability of goods and services combined with a number of other factors including: (1) pent-up consumer demand as reflected in elevated savings levels funded in part from pandemic relief checks, (2) bottlenecks in global supply chains, and (3) a soaring money supply stemming from unprecedented federal deficit spending. In California’s case, these have been compounded by various regulations putting additional pressure on individual consumer needs such as food and housing. For the 12 months ending May, the California CPI rose 4.3%. The most recent US CPI result for June was at 5.4%.
There are several ways to measure inflation. The Federal Reserve bases its policies on the Personal Consumption Expenditures Index (excluding energy and food), which is generally considered a more accurate measure of inflation that tracks with changes in consumption patterns. The consumer price index (CPI), however, is more widely reported and often used for contractual and statutory purposes. While the US CPI and its regional offspring are measured directly through monthly surveys, the California CPI is calculated by the Department of Finance as a weighted average of the MSA CPIs for Los Angeles, San Francisco, San Diego, and Inland Empire. These last two MSAs were only added in 2018, bringing some moderation to this measure that previously relied on two of the highest cost areas in the state.
The CPI only measures changes in price levels—it shows the rate at which those prices are rising, not a comparison between regions in the general price levels and costs of living. The significantly higher California inflation levels over the past six years have been applied to a much higher price base. As measured by the Bureau of Economic Analysis Regional Price Parity data, California in 2019 was the second most expensive state, behind only Hawaii. On a regional basis, California contained 7 of the 10 most expensive MSAs, including the top 2—San Francisco and San Jose. Additional comparisons at the state, county, and legislative district level are also available through the Center’s Affordability Index.
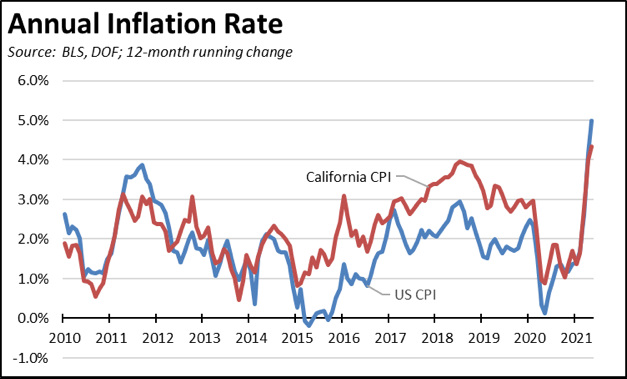
Comparing the two levels, however, reflects the extent to which California has outpaced the rest of the country in growing its high cost of living. During the recovery period following the Great Recession, the California CPI first tracked more closely with national numbers, but began diverging more widely beginning in 2015 as housing prices began recovery and as energy costs began rising rapidly as the result of the state’s regulations. With the state’s recovery generally lagging the rest of the country, the California CPI has again tracked the national results more closely, but is likely to diverge again as the economy picks up speed.
The state’s high energy costs play a key role in the state’s rising prices. These costs are reflected directly as in the case for fuel, add to the high cost of housing through rising utility bills, and increase pressures on every other good and service as energy is used for their production, transportation, storage, and sale.
California GHG Emissions Down 1.6% in 2019; Total US Emissions Down 1.7%
GHG Emissions, 2019
The recent release of the state’s GHG (greenhouse gas) emissions inventory for 2019 provides an opportunity to put the state’s soaring energy costs into perspective. The rapidly rising energy prices and costs detailed in the rest of this report are not necessarily the cost of pursuing a climate change program. Instead, they are the costs of the way the state has chosen to implement its program, with its emphasis on expanding and detailed regulations and the selection of favored technologies often through a political rather than a market process.
California is often touted and just as often self-touted as a leader in climate change. Yet a comparison with the national emissions inventory shows little difference in the results of the approach used by California compared to those in the rest of the country. The key distinction is in the high and increasing costs that come from California’s strategies.
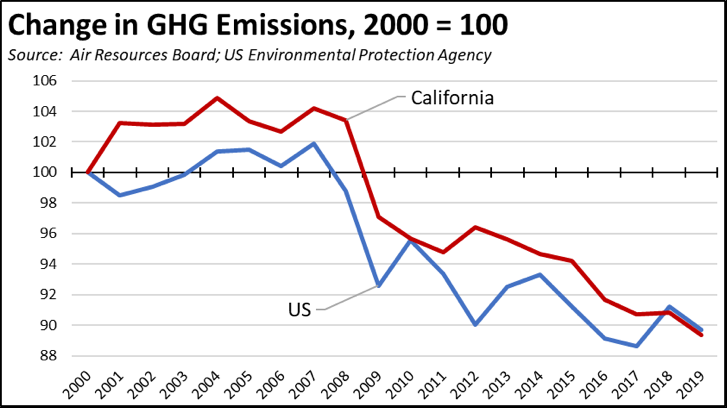
Both California and the US saw the sharpest drops in emissions during the Great Recession period, an outcome that is likely to be repeated in the subsequent results for at least 2020 and 2021. Through these and subsequent reductions, compared to 2000, California emissions dropped 10.6%; total US emissions dropped 10.3%. On a goal basis, California emissions in 2019 were 3.0% below the 1990 level; the US total was 1.8% above, but the ratchet nature of the national downward trend likely puts the US numbers only a few years behind the California progress.
In comparing the two, however, a number of factors should be kept in mind. As a state, at least some level of emissions has been moved rather reduced as manufacturing and other production has shifted, high-energy components such as server farms have gone to lower energy-cost states, and as the state has relied more on imports for its energy supplies. For example, California went from producing about half its oil use in the 1980s and 1990s, to currently importing most of its needs including from locations with far less environmental and labor regulation and/or involving increased transportation emissions. Similarly, the state has historically relied on other states for its natural gas supplies; a recent Air Board report indicates that emissions (100-year) associated with out-of-state gas production, processing, and transportation would put the state inventory 9.6 tons higher from this one factor alone. The state’s heavy reliance on solar fulfills its emissions goals for generation, but fails to address emissions at the other life-cycle stages. The California inventory benefits from having the rest of country in which to shift emissions. The national inventory by its nature takes all of these into account.
Although to a lesser extent than in prior years, California’s reductions also continue to rely on legacy investments in the state. In 2019, zero emission hydroelectric generation was up 46% from the prior year. In 2020, it was down 56%, and in 2021 the state has shut down capacity for the first time, having failed to make necessary investments to water reliability in spite of the warnings provided by three major droughts since the early 1990s.
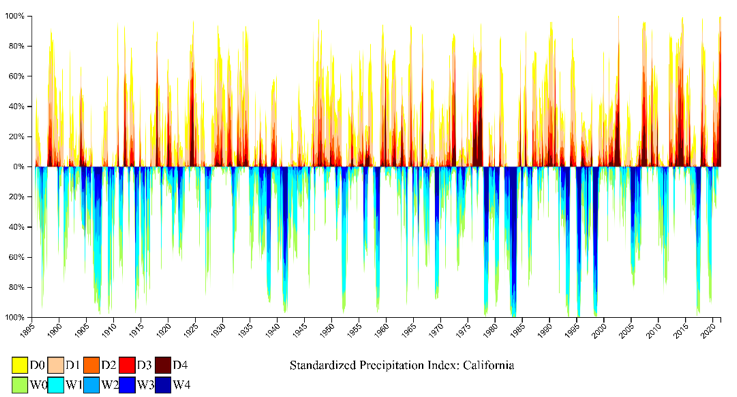
Source: NOAA, National Integrated Drought Information System
Similarly, neither inventory takes into account emissions related to wildfires. In 2018, the Air Board estimates 39.1 MMT CO2 emissions from wildfires in the state, or 31% of the national total. These numbers, though, are highly variable. Air Board pegs emissions at only 4.8 MMT in 2019, and preliminarily about 110 MMT in 2020, fully swamping whatever other progress the state has achieved through its other programs. The state budget has increased resources for forest and lands management, and the federal agencies have recently signaled an intent to improve their activities as well. But these steps are in contrast to previous years of disinvestments in these functions combined with years of repeated litigation that stalled federal actions on proper management.
These additional considerations, however, only intensify the conclusions from the official data. Both California and the rest of the nation have achieved comparable emission reductions in the last two decades, but as the result of fundamentally different approaches. The benefits have been essentially the same. The costs, as detailed below, are another story.
California vs. US Diesel Price
Above US Average
(CA Average)
The July average price per gallon of diesel in California rose 7 cents from June to $4.28. The California premium above the average for the US other than California ($3.20) rose to $1.08, a 33.8% difference.
In July, California had the 2nd highest diesel price among the states and DC, behind only Hawaii.
Range Between Highest and Lowest Prices by Region
Above US Average
(Central Sierra Region)
The cost premium above the US (other than California) average price for regular gasoline ranged from $1.19 in the Central Valley Region (average July price of $4.26), to $1.38 in Central Sierra Region (average July price of $4.45).
Highest/Lowest Fuel Prices By Legislative District:
California Residential Electricity Price
Rest Of US
California average Residential Price for the 12 months ended May 2021 was 21.33 cents/kWh, 67.2% higher than the US average of 12.76 cents/kWh for all states other than California. California’s residential prices remained the 6th highest in the nation, but are closing fast on the 5th highest, Massachusetts.
California Residential Electric Bill
For the 12 months ended May 2021, the average annual Residential electricity bill in California was $1,468, or 47.7% higher ($474) than the comparable bill in 2010 (the year the AB 32 implementation began with the Early Action items). In this same period, the average US (less CA) electricity bill for all the other states grew only 5.8% ($79).
Residential bills, however, vary widely by region, with the estimated annual household usage in 2019 as much as 76% higher in the interior regions compared to the milder climate coastal areas, and substantially higher when comparing across counties.
US Average Price
For the 12 months ended May 2021, California’s higher electricity prices translated into Residential ratepayers paying $8.2 billion more than the average ratepayers elsewhere in the US using the same amount of energy.
California Commercial Electricity Price
Rest Of US
California average Commercial Price for the 12 months ended May 2021 was 18.44 cents/kWh, 79.9% higher than the US average of 10.25 cents/kWh for all states other than California. California’s commercial prices were the highest among the contiguous states.
California Industrial Electricity Price
Rest Of US
California average Industrial Price for the 12 months ended May 2021 was 14.81 cents/kWh, 128.5% higher than the US average of 6.48 cents/kWh for all states other than California. Among the contiguous states, only Rhode Island was higher.
US Average Price
For the 12 months ended May 2021, California’s higher electricity prices translated into Commercial & Industrial ratepayers paying $12.3 billion more than ratepayers elsewhere in the US using the same amount of energy. Compared to the lowest rate states, Commercial & Industrial ratepayers paid $15.7 billion more.
California Natural Gas Prices
Average prices ($ per thousand cubic feet) for the 12 months ended May 2021 and changes from the previous 12-month period for each end user: