Below are the monthly updates from the most current June 2024 fuel price data (GasBuddy.com) and April 2024 electricity and natural gas price data (US Energy Information Administration). To view additional data and analysis related to the California economy visit our website at www.centerforjobs.org/ca.
California Electricity Rates Highest Among Contiguous States
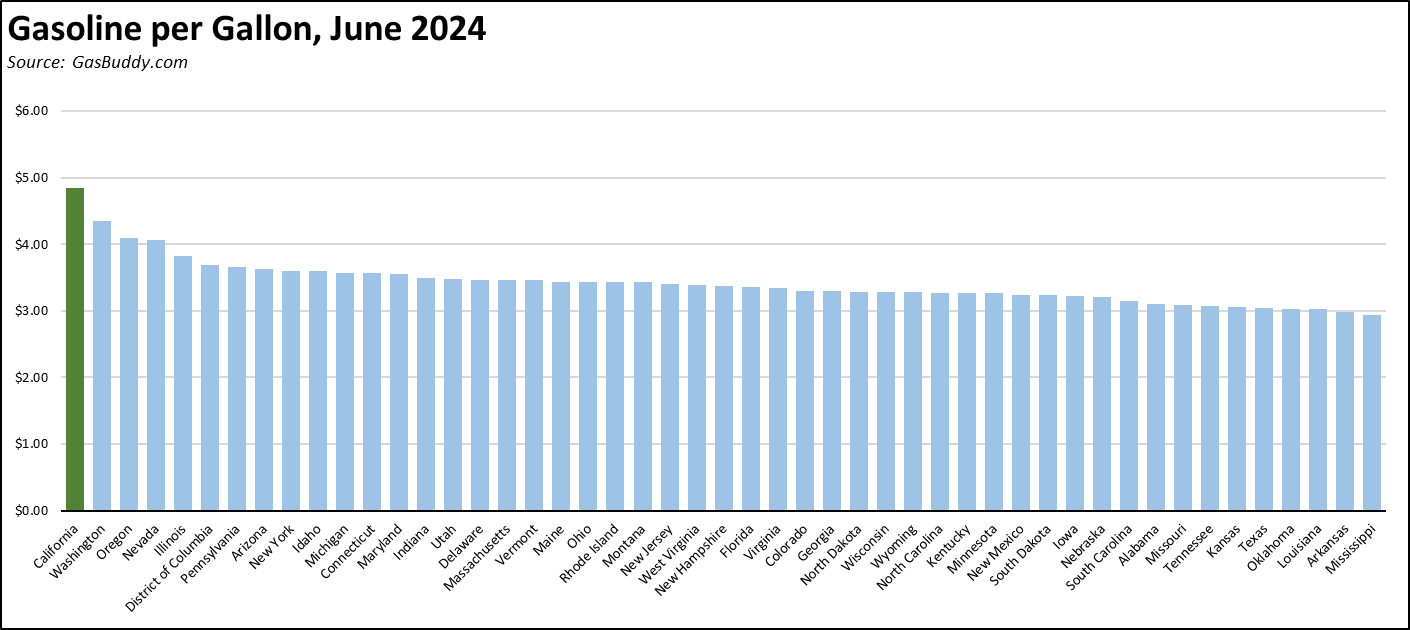
In April, California again posted the highest electricity rates among the contiguous states across all three major end use sectors. California gasoline and diesel remained the highest as well, with taxes and fees rising at the beginning of July to partially offset the drop in price per gallon. The tax and fee component is scheduled to rise substantially over the next few years in response to ongoing Air Resources Board rulemakings.
Inflation Unchanged
April 2023
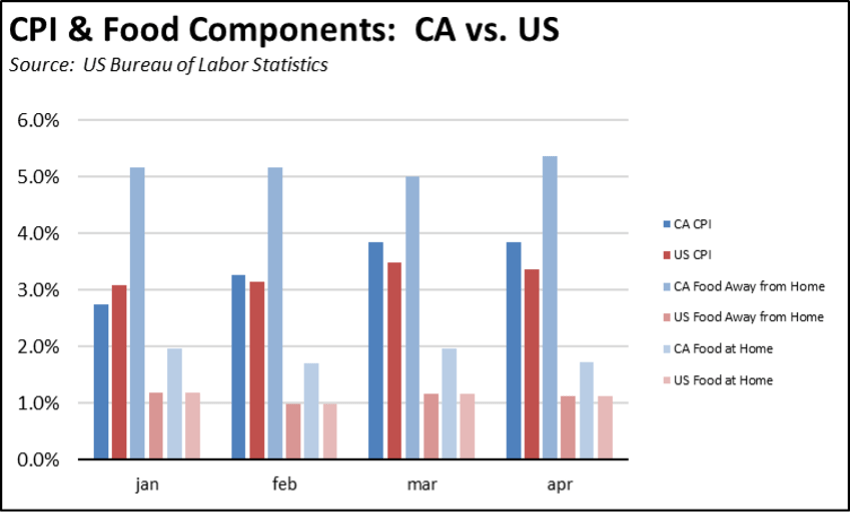
For the 12 months ending April, the California CPI rose 3.8%, matching the 12-month rise in March. In the same period, the US CPI notched down to 3.4% from 3.5% in April.
Using the same formula used by Department of Finance to calculate the California CPI, the California Food Away from Home (restaurants and take out) component rose 5.4% in April as costs continued to rise under the state’s new minimum wage, compared to only 1.1% for the US as a whole. The cost of Food at Home has been rising at a shallower rate, but at still about 60% above the overall US average.
California Gasoline Taxes & Fees
Fees per Gallon
Of Gasoline
In June, California Energy Commission data indicates that $1.41 (30.1%) of the price of a gallon of regular gasoline was paid to cover state, local, and federal taxes and fees.
Following yet another increase in the state fuel taxes, the Energy Commission data indicates that even though the average price per gallon dropped in the first week of July, taxes and fees rose to 31.0% of the total amount paid by motorists.
Pending Air Resources Board regulations would raise these costs much higher. While Board staff has since tried to downplay the published numbers, the Board’s economic impact statement on proposed changes to the Low Carbon Fuel Standard forecasts an additional pass-through cost of 47 cents a gallon for gasoline in 2025, rising to a peak of $1.83 by 2041. Expected diesel cost pass-throughs are 59 cents in 2025 and $2.40 in 2041. Jet fuel is at 44 cents in 2025 and $1.90 in 2041.
Proposed amendments to the Air Resources Board Cap-and-Trade also are expected to raise these costs as well. On an annualized basis, the additional costs to individuals are estimated at $90 a year per person across all energy platforms, or $360 for a family of four.
California vs. Rest of US Diesel Price
Above Other States
(CA Average)
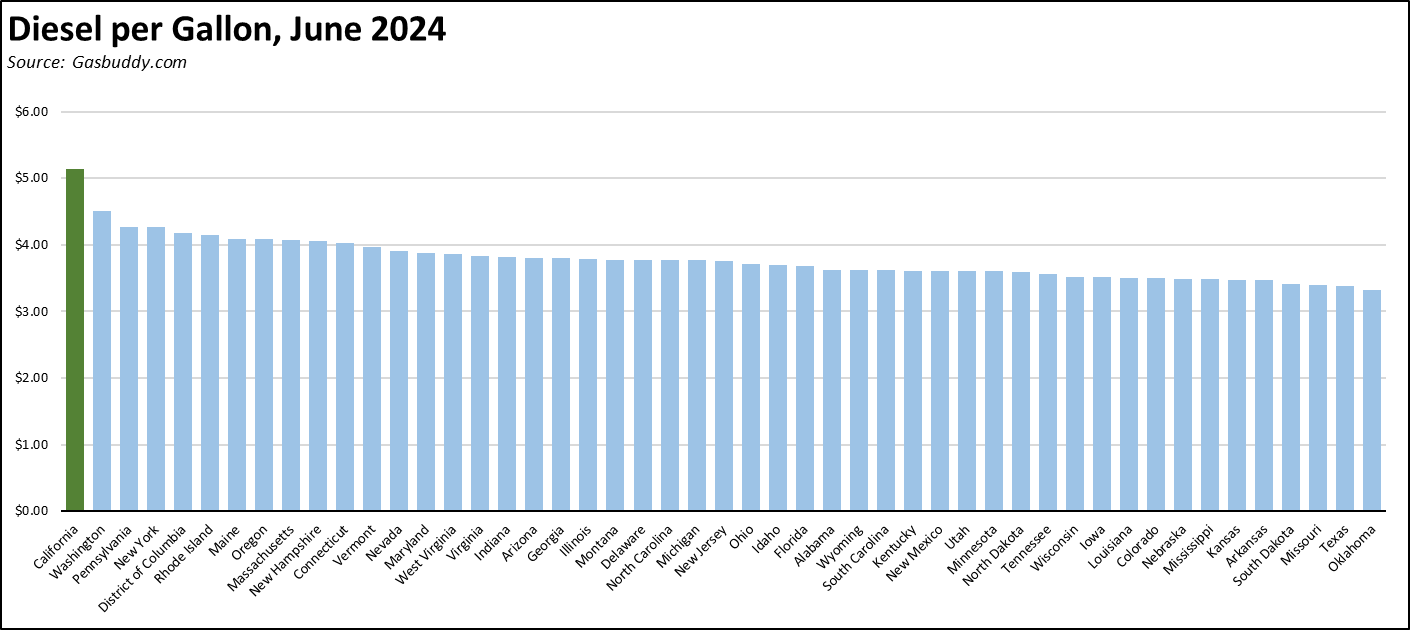
The June average price per gallon of diesel in California eased 14 cents from May to $5.13. The California regulatory and tax premium above the average for the US other than California ($3.71) eased to $1.43, a 38.5% difference.
price
In June, California again had the highest diesel price among the contiguous states and DC.
Range Between Highest and Lowest Prices by Region
above Other States
(Central Coast Region)
The cost premium above the US (other than California) average price for regular gasoline ranged from $1.35 in the Orange County Region (average June price of $4.72), to $1.72 in Central Coast Region (average June price of $5.09).
Highest/Lowest Fuel Prices by Legislative District:
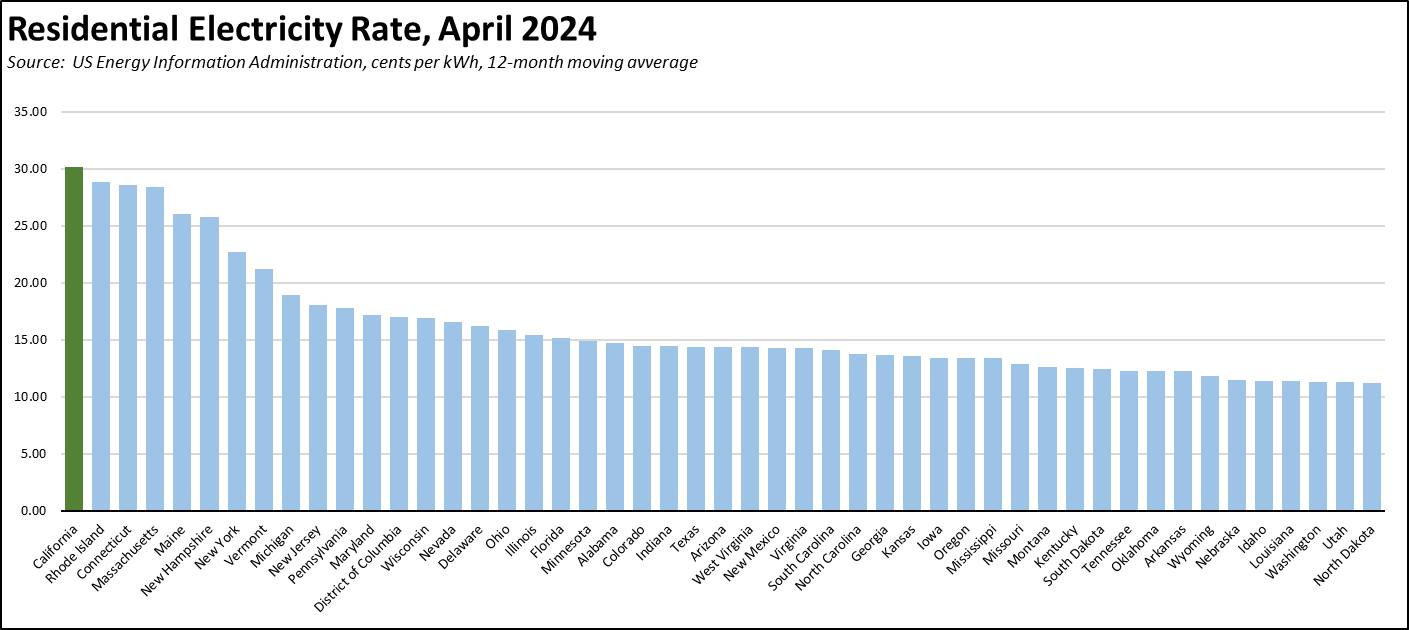
California Residential Electricity Price
Rest of US
California average Residential Price for the 12 months ended April 2024 was 30.16 cents/kWh, 97.6% higher than the US average of 15.26 cents/kWh for all states other than California. California’s residential prices again were the highest among the contiguous states and DC.
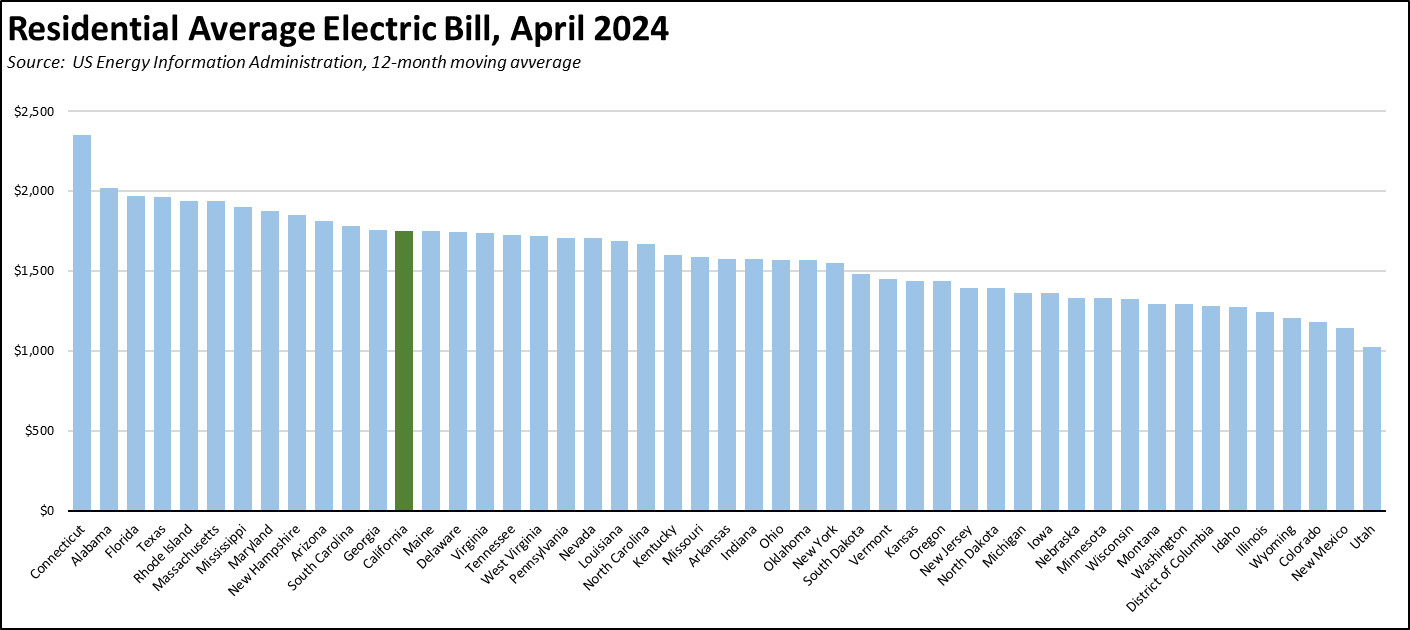
California Residential Electric Bill
For the 12 months ended April 2024, the average annual Residential electricity bill in California was $1,749, or 76.0% higher ($755) than the comparable bill in 2010 (the year the AB 32 implementation began with the Early Action items). In this same period, the average US (less CA) electricity bill for all the other states grew 21.0% ($286).
In 2010, California had the 9th lowest residential electricity bill among the contiguous states and DC. In the latest data, it tied with Maine for the 13th highest.
Residential bills, however, vary widely by region. Transforming the 2022 data recently released by the Energy Commission, estimated annual household usage is as much as 82% higher in the interior regions compared to the milder climate coastal areas, and substantially higher when comparing across counties.
Average Price in
Other States
For the 12 months ended April 2024, California’s higher electricity prices translated into Residential ratepayers paying $12.2 billion more than the average ratepayers elsewhere in the US using the same amount of energy. Compared to the lowest cost state, California households paid $15.5 billion more.
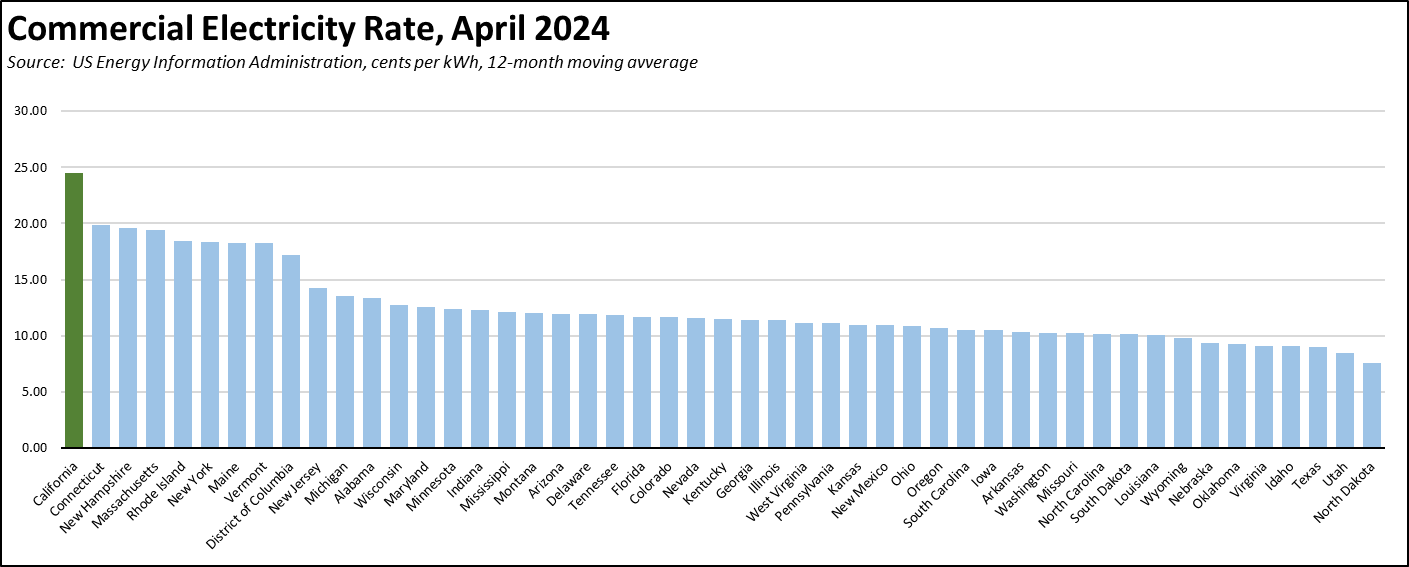
California Commercial Electricity Price
Rest of US
California average Commercial Price for the 12 months ended April 2024 was 24.46 cents/kWh, 107.6% higher than the US average of 11.78 cents/kWh for all states other than California. California’s commercial prices again were the highest among the contiguous states and DC.
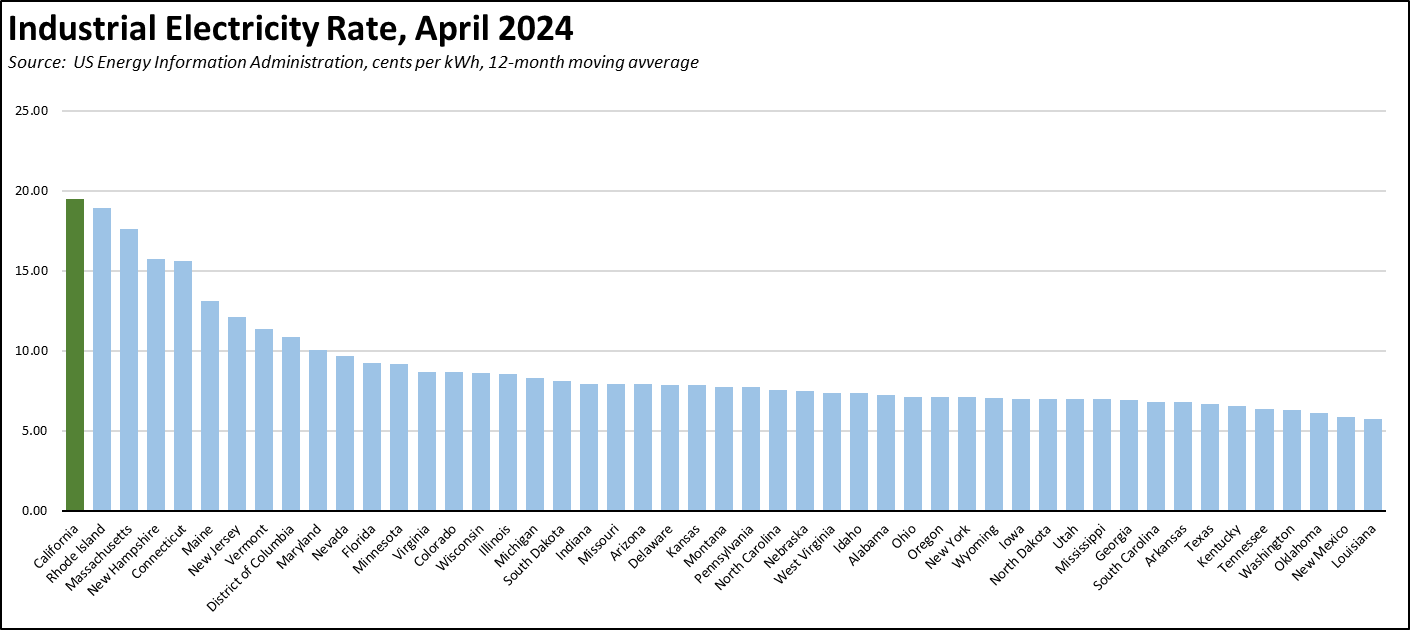
California Industrial Electricity Price
Rest of US
California average Industrial Price for the 12 months ended April 2024 was 19.52 cents/kWh, 157.2% higher than the US average of 7.59 cents/kWh for all states other than California. California’s industrial prices again were the highest among the contiguous states and DC.
Average Price in
Other States
For the 12 months ended April 2024, California’s higher electricity prices translated into Commercial & Industrial ratepayers paying $19.4 billion more than ratepayers elsewhere in the US using the same amount of energy. Compared to the lowest rate states, Commercial & Industrial ratepayers paid $24.9 billion more.
California Natural Gas Prices
Average prices ($ per thousand cubic feet; 12-month moving average) for the 12 months ended April 2024 and changes from the previous 12-month period for each end user: