
Below are the monthly updates from the most current March 2026 fuel price data (GasBuddy.com) and January 2026 electricity and natural gas price data (US Energy Information Administration). To view additional data and analysis related to the California economy visit our website at www.centerforjobs.org/ca.
The most current data again shows California with the highest or near the highest energy costs among the contiguous states, with the rankings largely stable except for the average residential electricity bill which continues to shift as rates and usage in the other states reflect wintertime use as well as incorporating added costs as the result of clean energy and pipeline restrictions.
But while electricity and natural gas prices remained within their current trajectories, fuel costs continued to spike as result of the actions in Iran and restrictions on traffic through the Strait of Hormuz. Fuel prices were the highest in the US, with the spread between California and the other states continuing to widen due to the state’s higher production and regulatory costs and self-imposed vulnerability to imports. Fuel prices were already rising due to the seasonal factors coming from increased driving and the biannual changeover in fuel specifications, along with increasing import dependence as the state’s refinery capacity is on course to shrink by 23% between 2019 and 2026. Current conditions have accelerated this rise further.
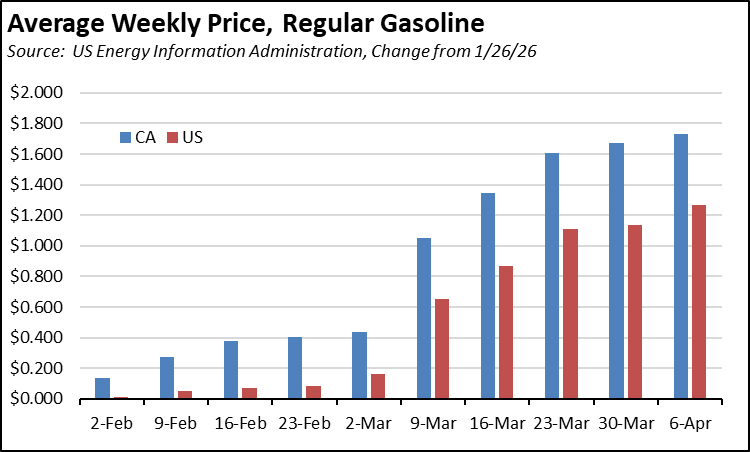
Compared to the week ending January 26, average weekly prices in California rose by $1.73 a gallon as of the week of April 6 compared to $1.27 in the US average. As a result, the spread in gasoline prices rose in this period from $1.19 a gallon to $1.65. As indicated in the chart, the increase in the price rise has begun to moderate, but prices still continue to climb.
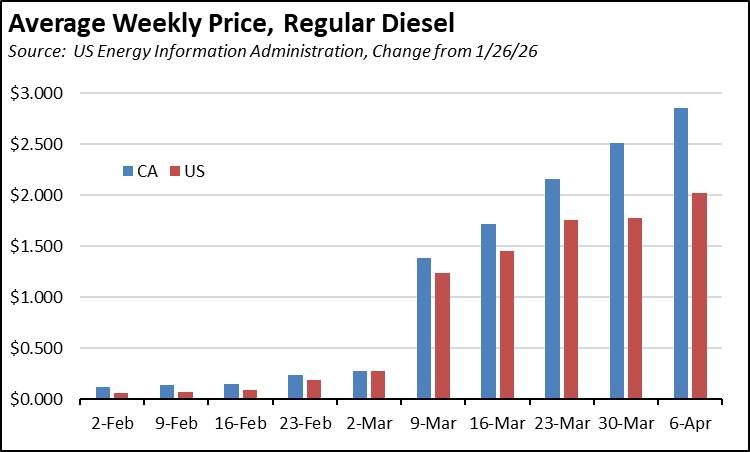
Tighter supplies in the diesel market have shown a stronger price response. California average prices rose $2.86 through March 30 compared to the US at $2.02. And while the price acceleration shows similar moderation in the US numbers, diesel prices remain on a consistent upswing in California as the state continues to lose refinery capacity in this period. As the predominant fuel for agriculture and goods movement, the diesel price has a direct bearing on the costs of living as evidenced by the growing number of fuel surcharges being applied to goods deliveries.
Inflation
For the 12 months ending January, the California CPI rose 3.0%, easing from 3.2% for the year ending December. In the same period, the US CPI went to 2.4% in January from 2.7% in December. Using the same Department of Finance weighting formula, Food at Home (groceries) rose 2.7% in California compared to 2.1% for the US. Food Away from Home (restaurants and takeout) rose 3.1% compared to the US at 4.0%.
California Gasoline Taxes & Fees
Gallon of Gasoline
As we have discussed in prior reports, in the absence of current Energy Commission data, we have begun our own estimates using the Commission factors and the new OPIS data. In March, $1.47 (26.1%) of the price of a gallon of regular gasoline was paid to cover state, local, and federal taxes and fees.
California Carbon Taxes: LCFS and Cap & Trade
In March, total LCFS charges incorporated in the price Californians pay for fuel edged down 2 cents for gasoline and diesel, while the Cap & Trade component edged down 1 cent for both fuels. The costs shown in the table are for the penultimate month-to-date numbers from the OPIS Carbon Market Report, adjusted to incorporate state and local sales tax to account for the full additional costs imposed by these regulatory fees on fuel buyers. Certain Data or Information Provided By: Oil Price Information Service, LLC. Distribution of OPIS data without permission from OPIS is prohibited.
Combining the OPIS data (without the sales tax component) with the previous Energy Commission estimates, Cap & Trade costs have shown little change since last fall, although the current rulemaking by CARB is currently on track to increase these costs by an estimated average of 124% over the next 10 years. LCFS costs have begun to show an upward ratcheting path, although additional months will be required to confirm the shape of this trend. Note that both charts include both the Cap & Trade components charged at the rack and levied on production from the OPIS data, and only the rack component in the Energy Commission data.
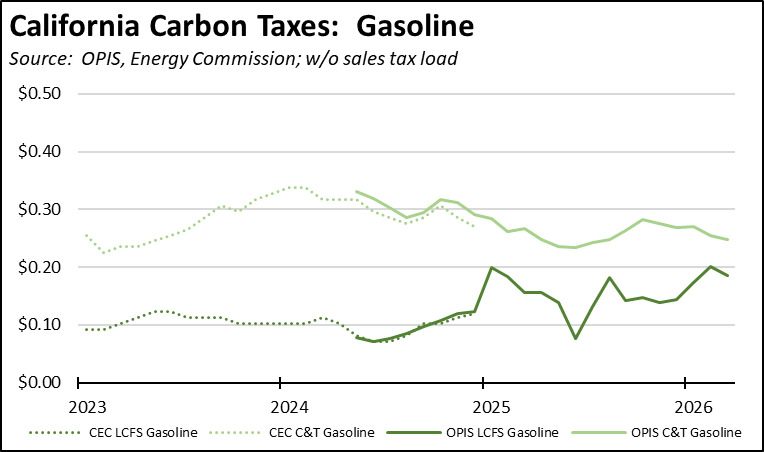
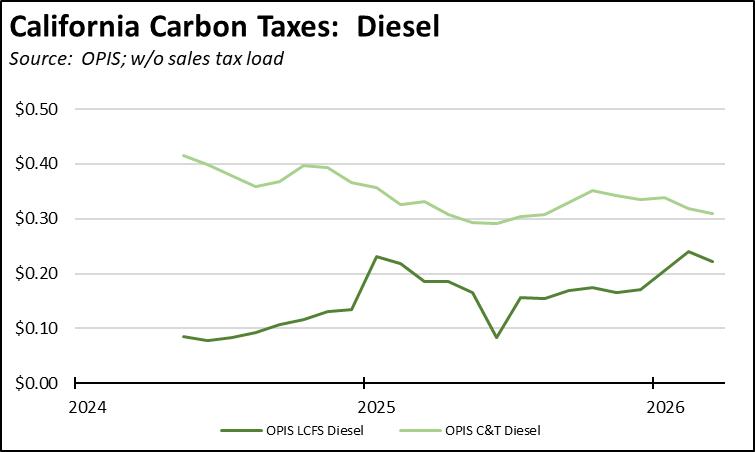
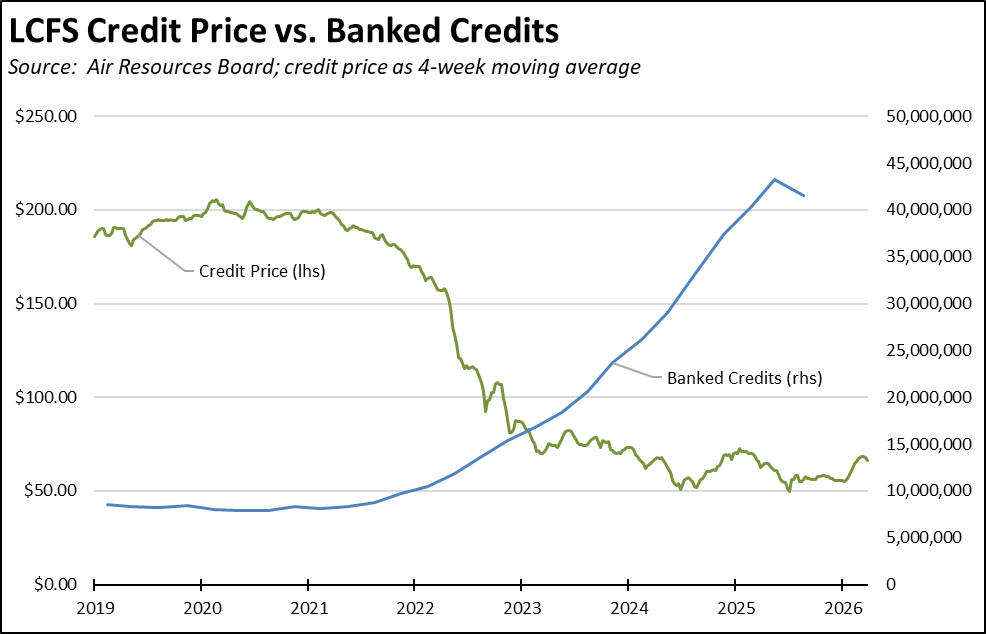
The component costs reflect trading in the underlying credits. OPIS data shows relatively little change in carbon credit prices since the end of January. The underlying credit prices for LCFS have returned to levels shown at the beginning of 2025, which incorrectly assumed implementation of the amended regulations at that point due to confusing information coming from the Air Board. Longer term price effects, however, remain governed by the extreme amount of banked credits still remaining in the system, although the latest report from CARB shows the first quarterly decline as the amended regulations begin to eat into this price buffer.
California vs. Rest of US Diesel Price
Above Other States
(CA Average)
The March average price per gallon of diesel in California rose $1.69 from February to $6.78. The California regulatory and tax premium above the average for the US other than California ($5.04) rose to $1.74, a 34.6% difference.
price
In March, California had the highest diesel price among the contiguous states and DC.
Range Between Highest and Lowest Prices by Region
above Other States
(Central Coast Region)
The cost premium above the US (other than California) average price for regular gasoline ranged from $1.78 in the Upstate California Region (average March price of $5.48), to $2.01 in Central Coast Region (average March price of $5.71).
Highest/Lowest Fuel Prices by Legislative District:
California Residential Electricity Price
Rest of US
California average Residential Price for the 12 months ended January 2026 was 32.47 cents/kWh, 95.7% higher than the US average of 16.59 cents/kWh for all states other than California. California’s residential prices were the highest among the contiguous states and DC.
California Residential Electric Bill
For the 12 months ended January 2026, the average annual Residential electricity bill in California was $1,888, or 89.9% higher ($894) than the comparable bill in 2010 (the year the AB 32 implementation began with the Early Action items). In this same period, the average US (less CA) electricity bill for all the other states grew only 33.4% ($456).
In 2010, California had the 9th lowest residential electricity bill among the contiguous states and DC. In the latest data, it had the 18th highest.
Residential bills, however, vary widely by region. Transforming the 2022 data recently released by the Energy Commission, estimated annual household usage is as much as 82% higher in the interior regions compared to the milder climate coastal areas, and substantially higher when comparing across counties.
Rest of US
For the 12 months ended January 2026, California’s higher electricity prices translated into Residential ratepayers paying $13.1 billion more than the average ratepayers elsewhere in the US using the same amount of energy. Compared to the lowest cost state, California households paid $17.0 billion more.
California Commercial Electricity Price
Rest of US
California average Commercial Price for the 12 months ended January 2026 was 26.25 cents/kWh, 110.0% higher than the US average of 12.50 cents/kWh for all states other than California. California’s commercial prices were the highest among the contiguous states and DC.
California Industrial Electricity Price
Rest of US
California average Industrial Price for the 12 months ended January 2026 was 21.64 cents/kWh, 165.5% higher than the US average of 8.15 cents/kWh for all states other than California. California’s industrial prices were the 2nd highest among the contiguous states and DC, marginally behind Rhode Island by 0.51 cent.
Rest of US
For the 12 months ended January 2026, California’s higher electricity prices translated into Commercial & Industrial ratepayers paying $21.2 billion more than ratepayers elsewhere in the US using the same amount of energy. Compared to the lowest rate state, Commercial & Industrial ratepayers paid $27.8 billion more.
California Natural Gas Prices
Average prices ($ per thousand cubic feet; 12-month moving average) for the 12 months ended January 2026 and changes from the previous 12-month period for each end user: