
Below are the monthly updates from the most current May 2026 fuel price data (GasBuddy.com) and March 2026 electricity and natural gas price data (US Energy Information Administration). To view additional data and analysis related to the California economy visit our website at www.centerforjobs.org/ca.
California continues to the highest or near the highest energy costs among the contiguous states, with residential natural gas rates marginally improved to 4th highest and average residential electricity bill marginally worse at 19th highest in spite of the state’s more favorable climate conditions.
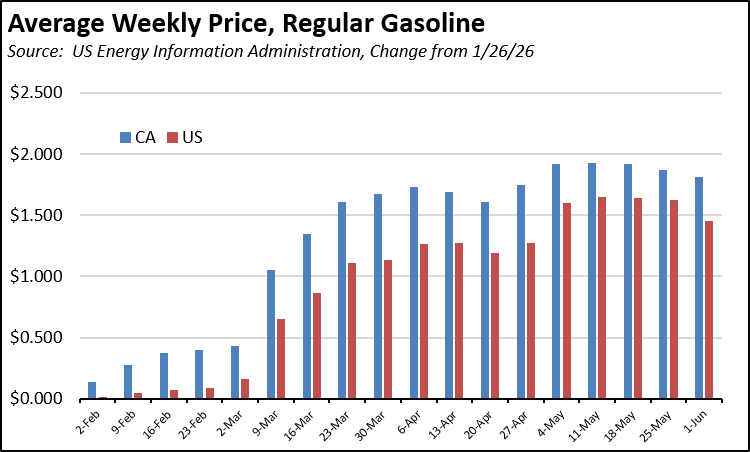
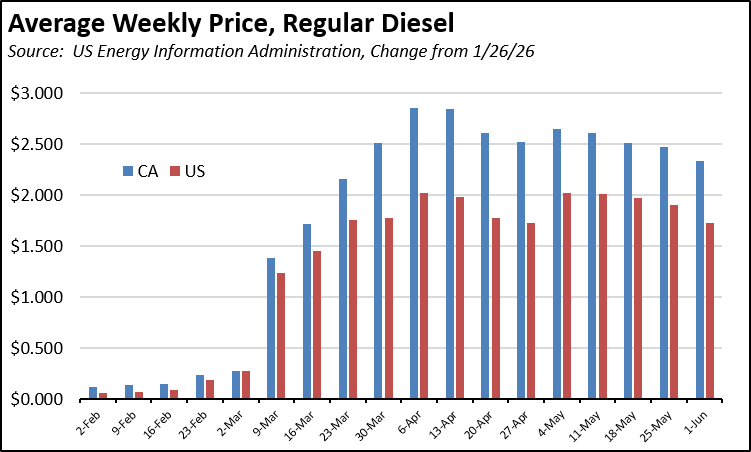
Fuel prices again showed little relief, with the average May gasoline price 2.7% higher (compared to 7.2% higher for the rest of the US) and diesel marginally lower at 2.5% (vs. 0.3% higher for the rest of the US). In the more recent weekly data from US EIA, the price increase for gasoline has shown minor easing in recent weeks in California and a somewhat more apparent effect in the US average as previous refinery issues have been resolved. Similar trends are also seen in more constrained diesel market but with the price increases down more from the previous highs at the beginning of April.
Inflation
For the 12 months ending March, the California CPI rose 3.3%, up from 2.9% for the year ending February. In the same period, the US CPI went to 3.3% in March from 2.4% in February. Using the same Department of Finance weighting formula, Food at Home (groceries) rose 2.9% in California compared to 1.9% for the US. Food Away from Home (restaurants and takeout) rose 3.2% compared to the US at 3.8%.
California Gasoline Taxes & Fees
Gallon of Gasoline
As we have discussed in prior reports, in the absence of current Energy Commission data, we have begun our own estimates using the Commission factors and the new OPIS data. In May, $1.54 (25.3%) of the price of a gallon of regular gasoline was paid to cover state, local, and federal taxes and fees.
California Carbon Taxes: LCFS and Cap & Trade
In May, total LCFS charges incorporated in the price Californians pay for fuel rose 1 cent for gasoline but were unchanged for diesel, while the Cap & Trade component also showed no change. The costs shown in the table are for the penultimate month-to-date numbers from the OPIS Carbon Market Report, adjusted to incorporate state and local sales tax to account for the full additional costs imposed by these regulatory fees on fuel buyers. Certain Data or Information Provided By: Oil Price Information Service, LLC. Distribution of OPIS data without permission from OPIS is prohibited.
Both carbon taxes have seen little change over the past 4 months. The LCFS component has generally remained at the level previously expected for the amended regulations at the beginning of the year, while the current trend for the Cap & Trade component remains subject to the current CARB rulemaking. Note that both charts include both the Cap & Trade components charged at the rack and levied on production from the OPIS data, and only the rack component in the Energy Commission data.
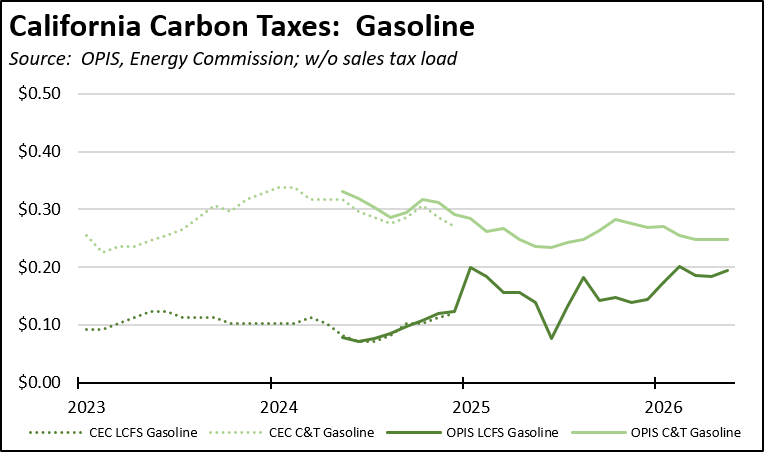
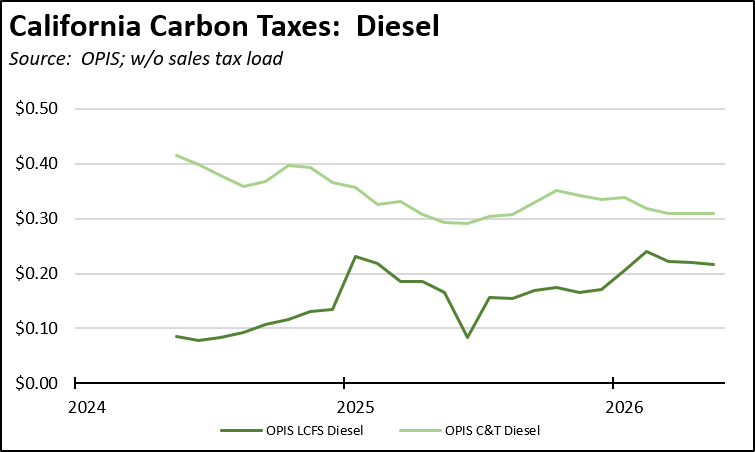
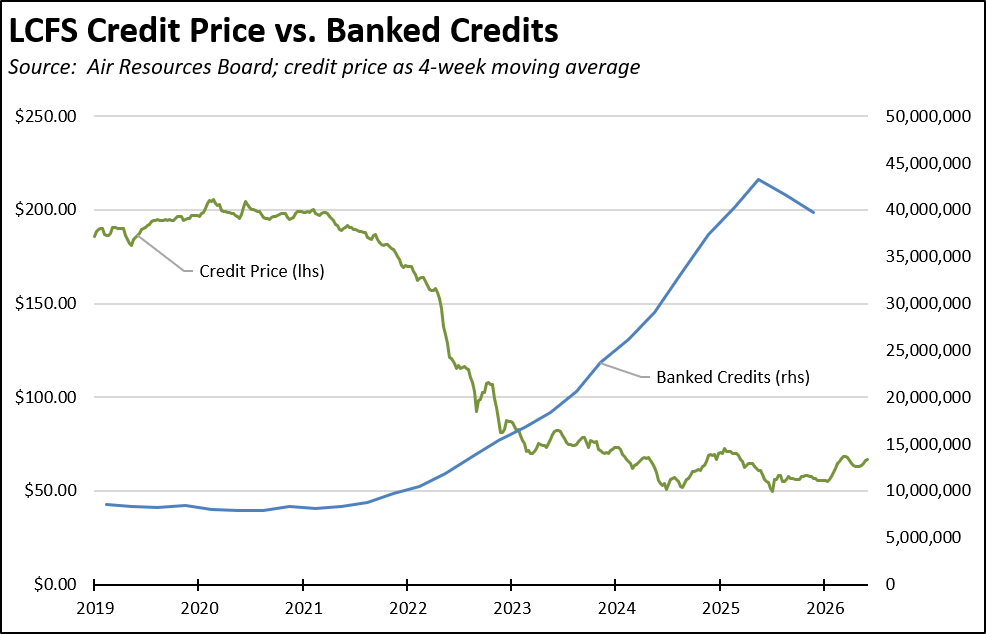
The current relative stability in the LCFS component remains subject to the large amount of banked credits. On a 4-week moving average basis, credit prices have risen 20.3% since the beginning of the year, but have seen only small fluctuations around their current point since mid-February. The most current banked credit report from CABR shows 2025:Q4 with the second decline in a row. As this buffer is reduced further, credit prices and the costs to employers and households are likely to move higher.
California vs. Rest of US Diesel Price
Above Other States
(CA Average)
The May average price per gallon of diesel in California eased 18 cents from April to $7.39. The California regulatory and tax premium above the average for the US other than California ($5.45) eased to $1.94, a 35.6% difference.
price
In May, California had the highest diesel price among the contiguous states and DC.
Range Between Highest and Lowest Prices by Region
above Other States
(Central Coast Region)
The cost premium above the US (other than California) average price for regular gasoline ranged from $1.70 in the Central Valley Region (average May price of $6.03), to $1.93 in Central Coast Region (average May price of $6.26).
Highest/Lowest Fuel Prices by Legislative District:
California Residential Electricity Price
Rest of US
California average Residential Price for the 12 months ended March 2026 was 32.66 cents/kWh, 94.5% higher than the US average of 16.79 cents/kWh for all states other than California. California’s residential prices were the highest among the contiguous states and DC.
California Residential Electric Bill
For the 12 months ended March 2026, the average annual Residential electricity bill in California was $1,903, or 91.4% higher ($909) than the comparable bill in 2010 (the year the AB 32 implementation began with the Early Action items). In this same period, the average US (less CA) electricity bill for all the other states grew only 34.7% ($474). In 2010, California had the 9th lowest residential electricity bill among the contiguous states and DC. In the latest data, it had the 19th highest.
Residential bills, however, vary widely by region. Transforming the 2024 data recently released by the Energy Commission, estimated annual household usage is as much as 80% higher in the interior regions compared to the milder climate coastal areas, and substantially higher when comparing across counties.
Rest of US
For the 12 months ended March 2026, California’s higher electricity prices translated into Residential ratepayers paying $13.2 billion more than the average ratepayers elsewhere in the US using the same amount of energy. Compared to the lowest cost state, California households paid $17.0 billion more.
California Commercial Electricity Price
Rest of US
California average Commercial Price for the 12 months ended March 2026 was 26.62 cents/kWh, 110.6% higher than the US average of 12.64 cents/kWh for all states other than California. California’s commercial prices were the highest among the contiguous states and DC.
California Industrial Electricity Price
Rest of US
California average Industrial Price for the 12 months ended March 2026 was 21.64 cents/kWh, 162.9% higher than the US average of 8.23 cents/kWh for all states other than California. California’s industrial prices were the highest among the contiguous states and DC.
Rest of US
For the 12 months ended March 2026, California’s higher electricity prices translated into Commercial & Industrial ratepayers paying $21.3 billion more than ratepayers elsewhere in the US using the same amount of energy. Compared to the lowest rate state, Commercial & Industrial ratepayers paid $28.1 billion more.
California Natural Gas Prices
Average prices ($ per thousand cubic feet; 12-month moving average) for the 12 months ended March 2026 and changes from the previous 12-month period for each end user: