Below are the monthly updates from the most current October 2023 fuel price data (GasBuddy.com) and August 2023 electricity and natural gas price data (US Energy Information Administration). To view additional data and analysis related to the California economy visit our website at www.centerforjobs.org/ca.
Key Takeaways
Inflation Rises
For the 12 months ending August, the California CPI rose 3.6%, up from 3.1% in July. In the same period, the US CPI rose 3.7%, up from 3.2% in July. Applying the same weighting formula to the individual CPI components, Food Away from Home (take out and restaurants) rose 5.9%, down marginally from 6.1% in July.
California vs. Rest of US: Fuel Price Gap at 60.9% Premium
As refineries shift into production of winter formulation fuels, gasoline prices began to drop 25 cents a gallon from September in California and slightly more at 27 cents in the other states and DC. Diesel prices, however, remained high.
In the most recent results from CSAA as of November 15, gasoline was down more sharply by another 44 cents to $5.05 in California, and down another 22 cents to $3.35 in the overall US average. Despite the intention of both Russia and Saudi Arabia to go ahead with previously announced production cuts to support global crude price levels, prices at the pump are likely to continue easing as driving and demand shift from the seasonal highs. The one major element of uncertainty, however, remains the ongoing situation in the Middle East and the potential for Iran to spark a broader conflict. In this event, California with its growing reliance on imports will likely face the potential for greater price volatility than the other states.
The October average price per gallon of regular gasoline in California eased 25 cents from September to $5.49. The California premium above the average for the US other than California ($3.41) rose to $2.08, a 60.9% difference.
In October, California had the highest gasoline price among the contiguous states and DC. Californians paid $2.46 a gallon more than consumers in Georgia, the state with the lowest price.
California vs. Rest of US Diesel Price
Above US Average
(CA Average)
The October average price per gallon of diesel in California eased 7 cents from September to $6.25. The California premium above the average for the US other than California ($4.35) eased to $1.90, a 43.7% difference.
In October, California had the highest diesel price among the contiguous states and DC.
Range Between Highest and Lowest Prices by Region
US Average (San
Diego/Imperial Region)
The cost premium above the US (other than California) average price for regular gasoline ranged from $1.93 in the Sacramento Region (average October price of $5.34), to $2.23 in San Diego/Imperial Region (average October price of $5.64).
Highest/Lowest Fuel Prices by Legislative District:
California Energy Prices the Highest or Near the Highest Among the Contiguous States
Fuels are not the only energy source for which California prices rank the highest or near the highest as state regulations, taxes, and fees have continued to push prices ever higher. Incorporating the annual and monthly revisions, the average price rankings for each energy source are shown in the following table.
California Residential Electricity Price
California average Residential Price for the 12 months ended August 2023 was 27.77 cents/kWh, 84.2% higher than the US average of 15.08 cents/kWh for all states other than California. California’s residential prices were the 4th highest among the contiguous states and DC.
California Residential Electric Bill
For the 12 months ended August 2023, the average annual Residential electricity bill in California was $1,711, or 72.1% higher ($717) than the comparable bill in 2010 (the year the AB 32 implementation began with the Early Action items). In this same period, the average US (less CA) electricity bill for all the other states grew only 19.9% ($271).
In 2010, California had the 9th lowest residential electricity bill among the contiguous states and DC. In the latest data, it had the 18th highest.
Residential bills, however, vary widely by region. Transforming the 2022 data recently released by the Energy Commission, estimated annual household usage is as much as 82% higher in the interior regions compared to the milder climate coastal areas, and substantially higher when comparing across counties.
US Average Price
For the 12 months ended August 2023, California’s higher electricity prices translated into Residential ratepayers paying $11.0 billion more than the average ratepayers elsewhere in the US using the same amount of energy. Compared to the lowest cost state, California households paid $14.7 billion more.
California Commercial Electricity Price
of US
California average Commercial Price for the 12 months ended August 2023 was 23.31 cents/kWh, 97.5% higher than the US average of 11.80 cents/kWh for all states other than California. California’s commercial prices were the highest among the contiguous states and DC.
California Industrial Electricity Price
of US
California average Industrial Price for the 12 months ended August 2023 was 18.35 cents/kWh, 134.1% higher than the US average of 7.84 cents/kWh for all states other than California. California’s industrial prices were the 2nd highest among the contiguous states and DC.
US Average Price
For the 12 months ended August 2023, California’s higher electricity prices translated into Commercial & Industrial ratepayers paying $17.5 billion more than ratepayers elsewhere in the US using the same amount of energy. Compared to the lowest rate states, Commercial & Industrial ratepayers paid $22.4 billion more.
Fuel Prices Could Go Even Lower
The greater price easing now being experienced in California again reflects the core influence of the state’s regulations on its highest-in-the-nation fuel prices. For two years in a row, California has experienced high price volatility in response to rising world oil prices combined with production issues during the mandated annual turnover in fuel formulation. And also two years in a row, the governor responded to this regulation-induced volatility by relaxing the state regulations and directing the Air Resources Board to allow an early shift to the less-costly winter formulation.
These actions produced the intended results. As the regulations were eased, so were the high prices they impose on Californians. California fuel prices are still the highest in the nation, but the cost premium generated by the state’s policies came down as production costs declined, production efficiency increased as more gallons of gasoline can be produced from the same amount of crude under the winter compared to the summer formulation, and as the resulting supply tempered price spikes in California’s isolated fuel market.
California prices, however, could drop even lower by addressing the other state-imposed component behind these high costs. California affects fuel prices through its regulations, both directly through costs of production and indirectly by limiting supply through what fuels can be sold in the state. California also has the highest fuel taxes and fees of any state, 146% higher than the average for the other states and DC in 2023. For two years running, the governor responded to high prices by relaxing the regulations, an action that takes time to filter down to the costs paid by consumers. Others instead called for immediate relief by cutting the state’s high gasoline tax, an action that was in fact partially embraced by the governor in his unsuccessful 2022 budget proposal to suspend the annual tax increase scheduled for July that year.
Using Energy Commission estimates for November 6, state and local taxes and fees levied directly on fuels boosted the average cost of gasoline by 33%. This total tax and fee charge ($1.24 per gallon) was responsible for 80% of the difference between average prices in California and in the US.
Of this amount, the state gasoline (excise) tax currently stands at 57.9 cents, and under current law will continue rising each July generally in accordance with the rate of inflation. Diesel is subject to a lower fuel tax of 34.5 cents, but also faces a sales tax rate of 13.0% compared to gasoline at 2.25%, plus any applicable district rates. Suspending or eliminating the state gasoline tax alone consequently would cut the current price premium paid in California by just under 40%. In terms of total potential savings, Department of Finance’s Schedule 8 estimates that the gasoline tax cost households and employers $7.3 billion in FY 2023, and the diesel tax another $1.4 billion.
Beyond just the matter of substantial potential savings to households, there are other reasons to consider the current high state taxes on fuels:
- California already has decided to eliminate these taxes; it’s just being done in the most disruptive way possible. Pursuant to executive orders and subsequent Air Resources Board regulations, the state has embarked on a process intended to phase out internal combustion engine (ICE) vehicles. And as these vehicles are phased out, so too will be the associated fuel sales and tax revenues. Given the crucial role these taxes now play in transportation funding and maintenance, not incorporating an alternative funding source into this significant policy change borders on the edge of fiscal irresponsibility. The current state policy on this issue appears to be to ignore it for now, and punt the decision down the road for others to handle as it becomes a crisis.
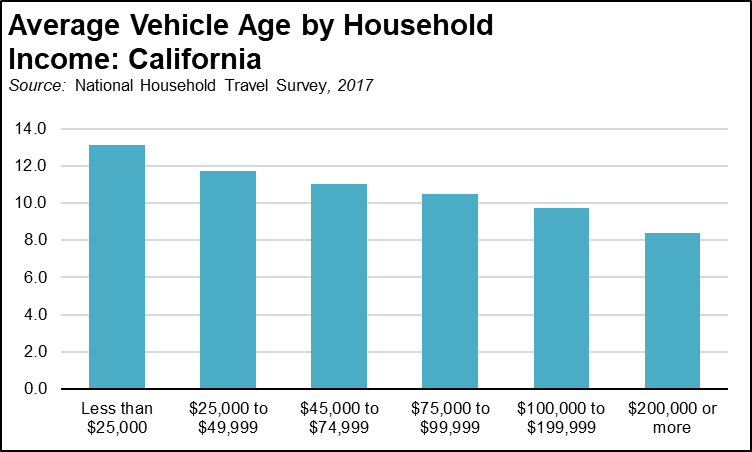
- The gasoline tax is regressive now and will become even more so in future years. Lower income households are more likely to drive older, lower mileage vehicles, and with the used electric vehicle market still yet to evolve, these are also more likely to be ICEs for the foreseeable future. In the latest data, the average vehicle owned by households earning less than $25,000 was nearly 5 years older than those in households earning $200,000 or more, while average vehicle miles traveled varies far less by income group.
Electric vehicle sales also continue to be heavily concentrated in upper income households. Using survey data from Hedges & Company covering the electric vehicle brand, Tesla, that dominates the market broken out for Model 3 and Models S and X, electric vehicle owners in 2022 have much higher average household incomes ($133,879 Model 3, $143,177 Model X, $153,313 Model S), are more likely to be white (87% white, 8% Latino, 5% other), older (median age 51 Model 3, 52 Model X, 54 Model 3), and male (84% Model 3, 71% Model X, 77% Model S) than the overall population. As upper income households exit the taxpaying base, the disparate incidence of this tax by income will only intensify over the coming years.
The fuel taxes originally were crafted essentially as a “user fee.” Those who used the state’s highways and streets paid for their construction and upkeep through these taxes, and the amount paid by each driver was roughly in proportion to how much use they made. The state’s current advocacy for electric vehicles while ignoring this fundamental infrastructure issue upsets this balance, putting increasing reliance on lower income households to continue paying the taxes to fund the highways and streets used by everyone else. In FY 2023, ICE vehicle owners paid a total of $8.7 billion in fuel taxes to support the state’s transportation systems. The higher income electric vehicle owners in stark contrast paid only $43 million through the Road Improvement Fee. - The state has the money to suspend or eliminate the tax. It’s just being spent on everything else. As discussed in our other reports, the state has been experiencing a series of “windfall revenue” years, supporting expenditures (general and special funds) that have been running over 20% higher at 9.0-10.4% of state personal income in the last three years compared to the 8.0% average that prevailed between FY 1979 and FY 2021. Revenues have been running so high that the state budget process this year began with an extra $128.4 billion in the bank at the beginning of FY 2023, built up from booming revenues from the prior years: $55.8 billion unspent general fund, $41.8 billion unspent special funds (of which $9.5 billion is covered by the Middle Class Tax Refund), and $30.8 billion in constitutional and statutory general fund reserves. While revenues are likely to run somewhat lower in the upcoming forecasts, it is still not clear the state’s budget situation is also still likely to be one of a reduced surplus rather than an actual deficit affecting baseline state responsibilities.
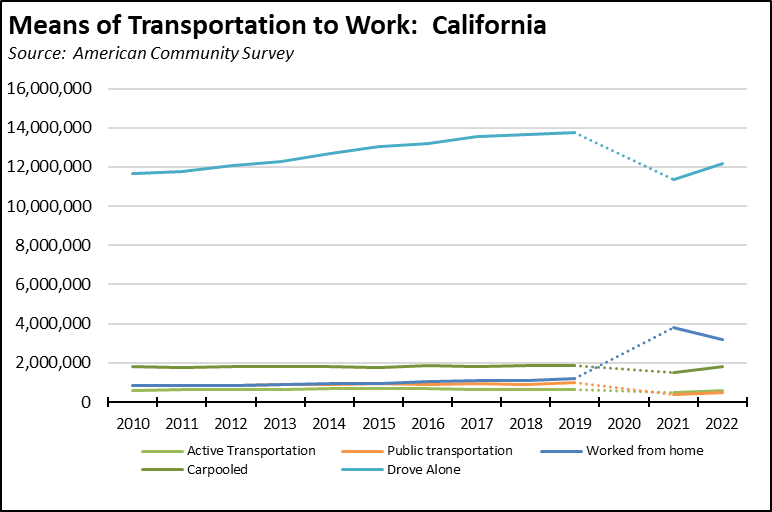
In 2017, the state fuel taxes were increased by $4.6 billion under SB 1 (Beal). During debate on the bill, legislative Republicans offered an alternative that would have raised $6 billion by relying instead on existing funds and with little impact on ongoing programs: (1) reallocate cap-and-trade fees paid through motorists, (2) truck weight fees, (3) $200 million from strategic growth funds, (4) $500 million from Caltrans efficiencies identified by LAO, (5) $685 million from eliminating one-fourth of long-term vacant state positions being used as agency slush funds, (6) $1 billion from annual general fund growth, and (7) reduced project costs from CEQA reform, public-private partnerships, and restoring Transportation Commission independence. The current surplus funds make even these changes unnecessary as revenue backfill. A Proposition 98-like reservation in fact could substitute for any new tax. - Surplus funds are now being spent on transportation modes even fewer people are using. The current budget in fact contains a significant shift of surplus general fund revenues to transportation infrastructure. Between FY 2021 to FY 2023, $7.65 billion is allocated to additional rail projects, and $1.05 billion to “active” transportation (e.g., walking, biking). The only problem is that this spending seeks to expand transportation fewer people are using every year.Using the commuting mode data from the American Community Survey, the 2022 results show 4,000 fewer people relying on “active transportation” than in 2010 when the state’s current climate change program began in spite of substantial investments in this mode. Public transportation is 326,000 lower, and carpooling only 62 persons higher. Use of single occupant vehicles in fact dropped from 84.7% of all commuters to 75.3% in 2022, but only as working from home soared from 5.2% to 17.2%.
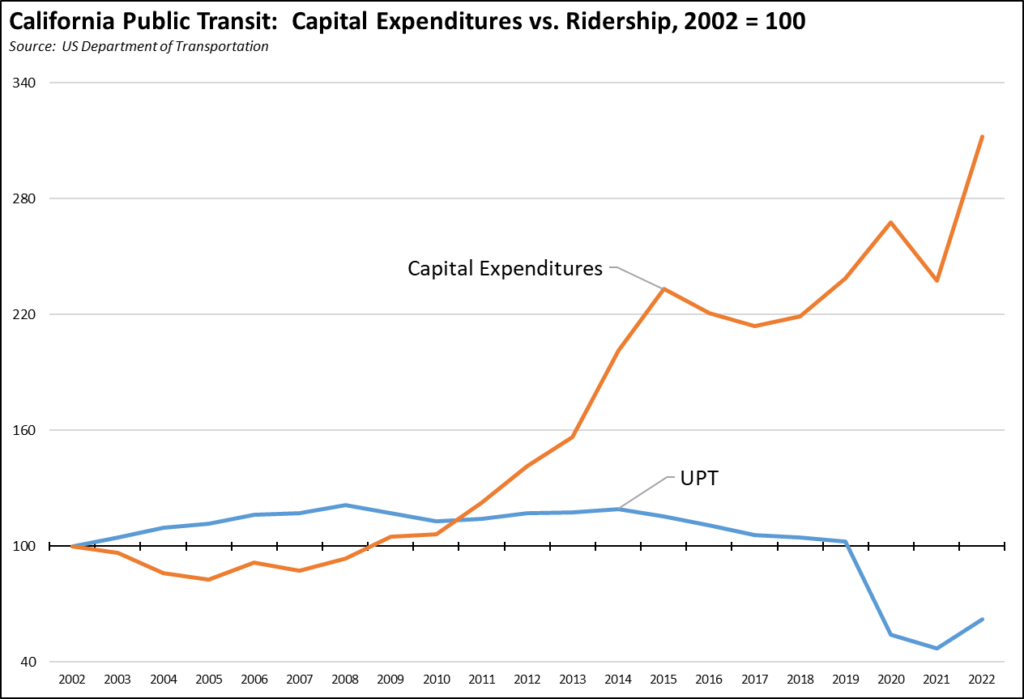
Public transit in particular has experienced declining overall use in spite of substantial and sustained investments into expanding these systems. Between 2002 and 2019, total annual capital expenditures in California grew 138% while ridership as measured by unlinked passenger trips (UPT) was basically unchanged at only 2% higher. In the most recent results for 2022, capital expenditures were 212% higher than in 2002, while UPT was 48% lower and still was struggling to recover from the pandemic plunge. The more that has been invested in these systems, the fewer the people who actually use them.
In spite of these dismal results, California continues to invest in alternative modes and the agencies continue to try to promote their use through an expanding and costly set of regulations and fees. These continue the combined efforts of the transportation, air, and energy agencies over the past 5 decades to reduce the total amount of vehicle miles traveled in this state. And as we discussed in a previous report, the only outcomes of these efforts have been to increase the cost of housing, commuting, and overall cost of living in this state without any compensating environmental or congestion benefits. The only measure that has shown significant results has been working from home, and the surge in this mode has largely come in spite of the agencies. The public investments in the nonperforming modes continue, however, largely driven by the ongoing belief that as personal vehicles become more expensive to purchase and operate under current state policies, people in the state at some point will have few options other than to turn to the alternative modes they have to date largely ignored.
CPUC Affordability Report: Electric Bills to Become Less Affordable at Least through 2026
In its largely overlooked 2021 and 2022 Affordability Report, the CPUC again highlighted the increasing unaffordability of electricity bills in the Central Valley and low income portions of the state’s urban areas. The analysis is centered on calculation of an affordability ratio (AR) at different income levels, determined as the share of income required to cover the basic service electricity bill after deducting housing and other essential service (utilities) costs. In the map below, AR20 indicates the resulting affordability ratios for electricity for households in the lowest 20% income level, with 15% of income devoted to electricity taken as the unaffordability threshold. The full report also calculates ARs for other utility services and for the bundled utility services.
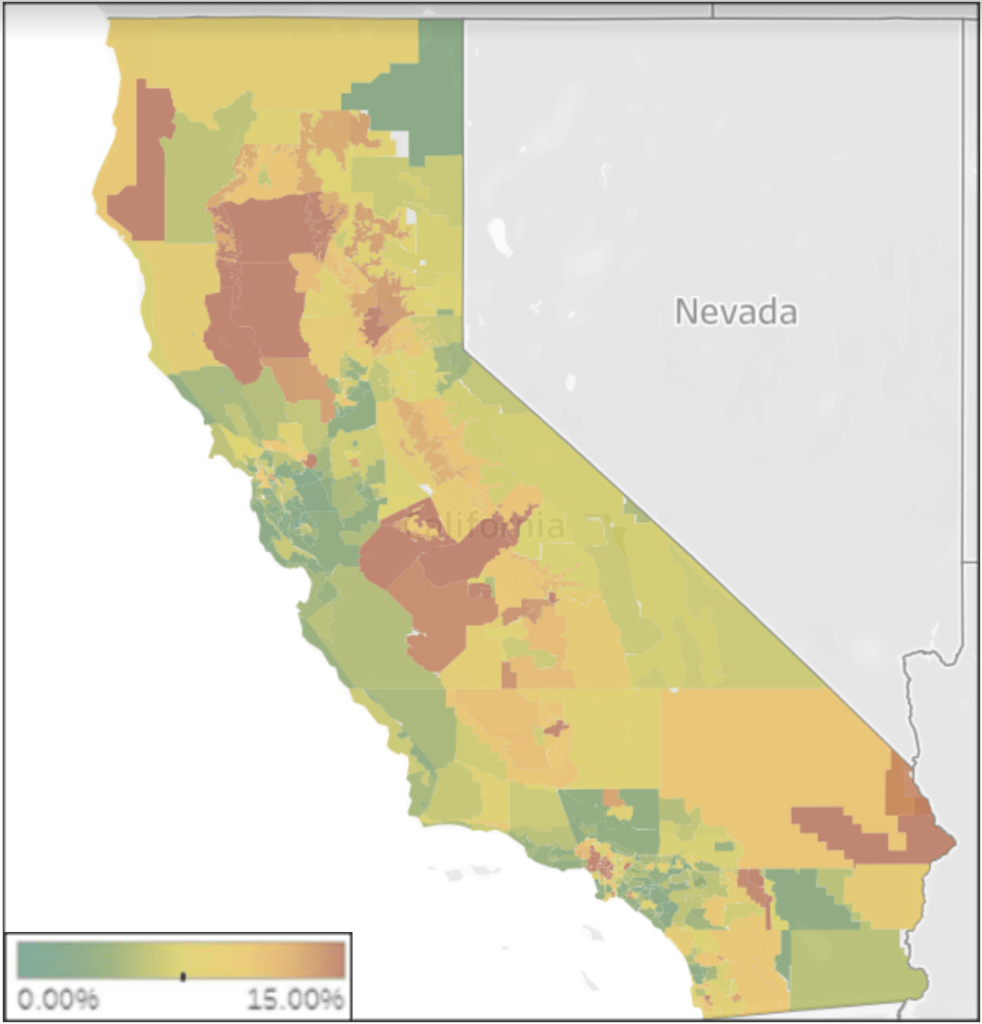
Electricity AR20, 2022
Source: CPUC 2021 and 2022 Affordability Report
Based on projections through 2026, the report also expects that electricity will become increasingly unaffordable for lower income households over next few years:
- Forecasted analysis indicates that electric bills started becoming much less affordable in 2022 and will continue on that trend until at least 2026, driven by forecasted increases in electricity rates.
- The most serious affordability concerns continue to be in particularly low-income parts of major metropolitan areas, as well as in the Central Valley. (CPUC 2021 and 2022 Affordability Report, p. 6, emphasis in original)
Weighting the individual utility forecasts by total 2022 sales, the report projects average electricity rates in the IOU (investor owned utility) service areas to rise another 32% between 2023 and 2026.
Average Residential Electricity Rate by Legislative District: 2022
The Affordability Report also contains data used to estimate average residential electricity rates in the state’s legislative districts in 2022. The table below summarizes the districts with the highest and lowest average rates. The full data and prior year estimates are contained on the Center’s website.
As indicated below, California’s policies have pushed electricity rates to the point that even the lowest cost district has an estimated average residential rate that is 22% higher than the average found in the other states and DC. The highest cost districts have rates that are 164% higher.
Data Note
The 2022 electricity data has been updated with the 2022 final results just released by EIA. Overall, the adjustments show slightly lower than previously reported prices for California residential (-1.3%), industrial (-1.6%), and average annual residential bill (-2.9%), and marginally higher (0.6%) for commercial. The averages for all states other than California show substantially smaller changes.
California Natural Gas Prices
Average prices ($ per thousand cubic feet; 12-month moving average) for the 12 months ended August 2023 and changes from the previous 12-month period for each end user: