Highlights for policy makers:
- COVID-19 and the State Economy
- Unemployment Rate Improves; Employment Up 291,600
- Labor Force Participation Rate Down to 59.9%
- Employment Growth Ranking
- Nonfarm Jobs Up 101.9k
- Jobs Change by Industry
- Unemployment Rates by Region (not seasonally adjusted)
- Unemployment Rates by Legislative District (not seasonally adjusted)
- How Far Back Has the Economy in Each County Been Pushed?
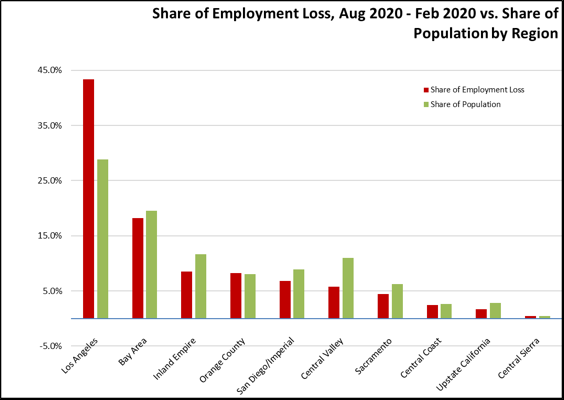
- Employment Share by Region
- MSAs with the Worst Unemployment Rates: Los Angeles Remains at 9th Worst in Nation
COVID-19 and the State Economy
While positive, the August numbers show recovery slowing in California especially when compared to somewhat better numbers in the other states and also when taking into consideration the downward adjustments in the July numbers. As measured by employment, California’s monthly growth was comparable to the other states but did little to close the large gap in overall recovery progress. As measured by jobs, there has only been a small upward shift since June. As in prior months, the August numbers also were rapidly overcome by subsequent events related to the ongoing pandemic crisis.
August Numbers in Context: Technical Issues. The monthly numbers continue to be affected by technical factors arising from the current crisis conditions, although the overall size of these effects has been receding. The response rate for the household survey used for the labor force estimates improved slightly but still remained low. The response rate for the establishment survey used in the jobs estimates continued to exceed the average for 2019. The effect of misclassifying unemployed persons continues to respond to changes in the survey methods, with the results in August at worse increasing the reported unadjusted unemployment rate by 0.7 point.
August Numbers in Context: Survey Timing. The surveys behind the labor force and jobs estimates were done the week of the 12th. Actions affecting these numbers following the surveys include:
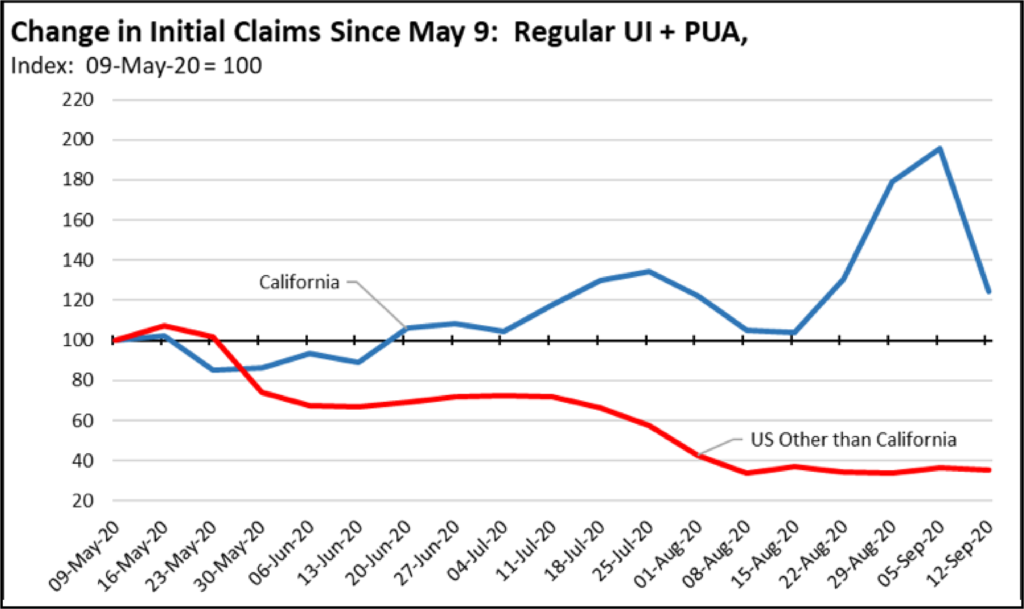
Tracking these events, initial unemployment claims for unemployment insurance saw a spike in the second half of August. While growing concerns with suspected fraud likely explain some of this outcome, fraud likely has been an element over the past several months given the overall rapid rise in the number of claims, the increased benefits offered through the related programs, and the administrative difficulties in handling the greatly expanded workload. While the numbers throughout the crisis period have to be considered from this factor, several other factors occurring later in August are likely behind at least a portion of this spike as well: (1) the events above for August 13, 17, and 28 likely resulted in additional layoffs; (2) most school districts delayed an open/close decision until the last minute either due to uncertainty or protracted labor negotiations, with affected school employees becoming eligible to file for unemployment only in the second half of the month; (3) families with children were also hit by the lateness of the school decisions, forced into choosing between jobs and childcare at the last minute (including potential eligibility for PUA based on child care responsibility if schools are closed); and (4) final legislative action on which self-employment options remain eliminated during the current economic crisis under AB 5 became apparent only towards the end of the session.
Regardless of the true size of the August spike, initial claims remain high and exhibit no signs of returning to historically normal levels soon. While the numbers for the rest of the country have essentially leveled out over the past 6 weeks, the California filings continue to be highly variable and continue to react to ongoing changes in which economic activities are allowed to open.
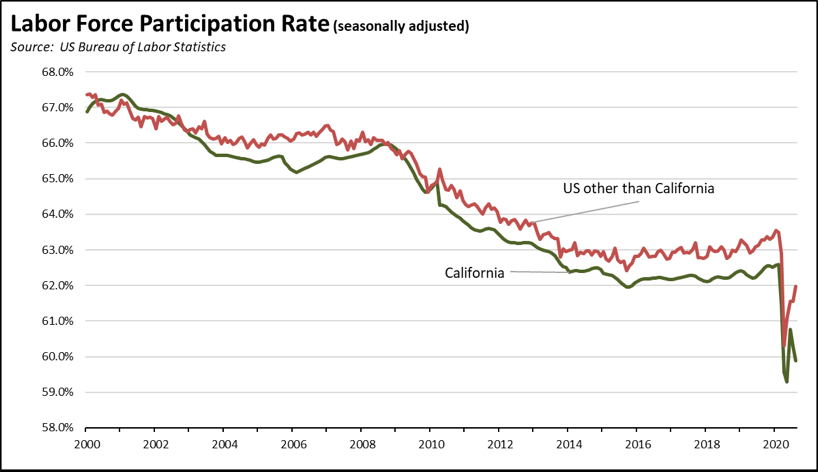
August Numbers in Context: Labor Force Continues to Decline.
The unemployment rate only reflects the labor situation for workers counted within the labor force. As indicated in the chart below, California’s labor force participation rate has sunk to new lows and dropped in the last two months. The labor force for the other states similarly experienced an initial sharp drop, but has been recovering since the low in April.
Looking only at the one-month change in August, 27% of the improvement in the unemployment rate came from further contractions in the labor force using the seasonally adjusted numbers, and 40% if using the more applicable unadjusted numbers. The 2.1% gap in the rate between California and the other states represents 670,000 workers not counted in the official numbers.
August Numbers in Context: Employment by Industry.
The August numbers are dominated by the change in Government jobs. Government accounts for two-thirds of the reported job increase for the seasonally adjusted numbers, and nearly three-quarters for the more applicable unadjusted numbers. Putting the Government jobs aside, August saw an increase of only 35,800 private sector nonfarm jobs in the adjusted numbers, and 41,300 in the unadjusted. These results indicate the state’s economy continues to be severely constrained by the current pattern of closures.
Recession Tracking. Comparing the situation in August with the numbers from a year ago, industries more heavily affected by the closures continue to show the greatest contractions, with industries having higher telecommuting potential showing more resiliency in the current situation. “Employment” is the number of persons age 16 and over working, including wage & salary jobs, self-employment, and non-paid family workers in the civilian workforce. “Jobs” are the number of wage & salary jobs, with individual workers holding one or more of these jobs.
Job numbers were below the 2019 levels in all but 2 industries, with the greatest contraction in lower wage Leisure & Hospitality where jobs are still down by about a third during what is typically the highest activity period for this industry.
Where the information is available, average hourly earnings rose in all industries. These numbers again likely reflect the fact that layoffs have generally affected lower wage workers more heavily. The averages went up because the lower wages were cut more proportionally.
Average weekly hours saw some positive growth in all industries except Construction and Manufacturing.
Source: US Bureau of Labor Statistics
Longer Term Uncertainty.
For California, the August numbers combined with subsequent events suggest at best a pause in the state’s economic recovery. Indicators of the longer-term prospects include the following:
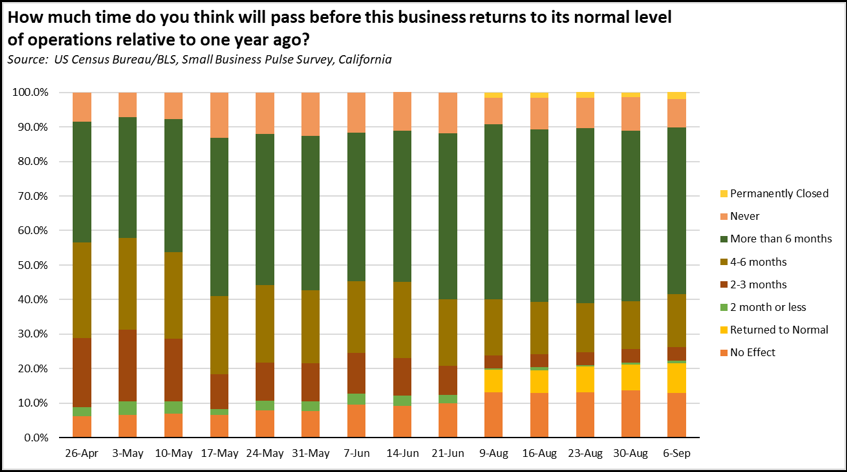
- The most recent Small Business Pulse Survey results for California indicate a lengthening horizon in the expectations of small business for a return to normal business operations. As indicated in the chart below, the share of those reporting 4 months to never has remained in the 72% to 80% range since the survey began in late April. Around three-quarters of small businesses have anticipated a lengthy recovery, and little has changed in this period to affect that planning horizon. The share of small businesses reporting no effect on their operations or a return to normal has increased, but that outcome was to be expected as businesses closed and this component increased in subsequent overall share.
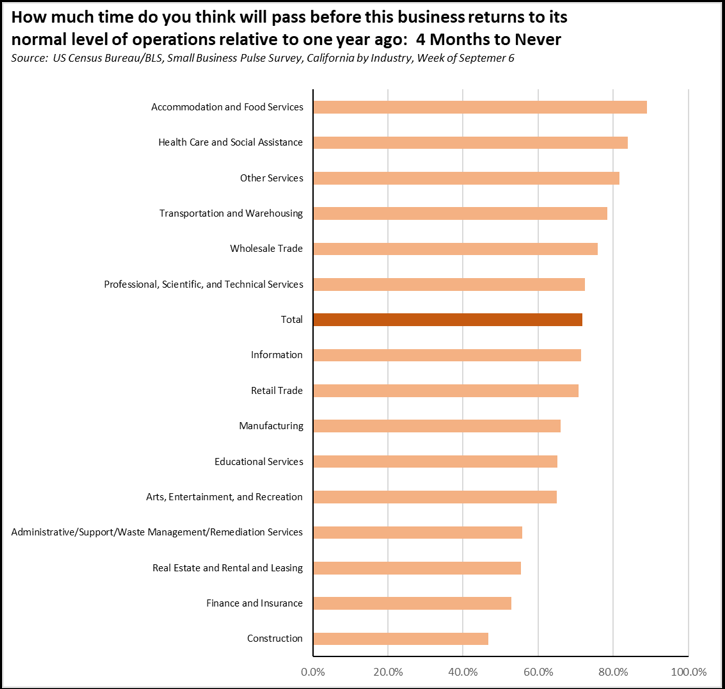
- Expectations, however, differ by industry. In the latest results, the small businesses reporting the longest expectations of return to normal (4 months to never) were those in the hardest hit industries to date, including Accommodation & Food Services, Social Assistance, and Other Services that in particular have seen layoffs concentrated in lower wage workers. Higher wage industries in general show expectations closer to the state average or quicker, suggesting that the current disparate effects on lower wage workers will continue well into and likely beyond the recovery period. This outcome would have the same outcome on longer term income distribution seen from a similar pattern in the recovery from the Great Recession.
- Going beyond these issues, a recent National Federation of Independent Businesses survey reported that 21% of small business owners indicated they will have to close their doors if economic conditions do not improve in 6 months. Another 19% said they would be able to operate no more than 7 to 12 months under the current conditions. Only 61% indicated they are able to continue operating in the current economic environment.
- This wage pattern is likely to be strengthened by the state’s current trend of increasing regulation and regulatory costs associated with bringing workers back to their jobs. The most recent weekly state income tax withholding still shows receipts tracking closely to 2019, again indicating that higher wage workers have been less affected in large part due to telecommuting options. For lower wage workers, employers will have to take into account both recovery expectations and the cost of employing workers that will grow as a result of changes in the state. For example, the scheduled increase in the minimum wage likely means fewer such workers can be recalled after factoring in the cost of increased wages, associated increases in employment taxes and benefits, and additional costs from dealing with wage compaction. This aspect will be less a factor in industries such as Manufacturing, Finance & Insurance, and Information that have far fewer minimum wage workers, but will be an element reducing the number of workers who can be recalled in the hardest hit industries such as Accommodation & Food Services and Other Services. Workers who are recalled will benefit from the higher wages. Those who are not risk facing the same long-term unemployment and diminishment of lifetime wage prospects experienced during the recent Great Recession recovery period.
- Similar results are contained in the Household Pulse Survey. In the latest results for the week of August 19, 34% of persons age 18 or over in California expected a loss of employment for themselves or a household member in the next 4 weeks, compared to 26% nationally. The results varied widely by wage level, with 42% (33% nationally) in households earning $50,000 and below expecting employment loss, compared to only 23% (17%) in households earning $100,000 and above.
- Earlier this summer, some employers encountered difficulties in rehiring workers due to the higher amounts many were able to receive from unemployment insurance compared to wages. With most schools now closed and conducting the school year remotely, employers are now beginning to encounter situations where workers are unable to return due to child care responsibilities. This situation is less a factor with higher wage workers who are able to telecommute and consequently juggle these responsibilities. Many workers earning less than $50,000 a year are in occupations that could telecommute as well, but as discussed in a forthcoming Center report are unable to do so due to restrictive state regulations.
While this limited data is in no way determinative, it suggests that under the current state policy course, the longer term effect on lower wage workers and consequently long term income distributions has the potential to be as disruptive or more so than the effects stemming from long term unemployment during the Great Recession recovery. Policy changes to date have served primarily to increase the costs of a return to normal operations rather than steps to expedite that return for all wage levels.
Unemployment Rate Improves; Employment Up 291,600
EDD reported total employment (seasonally adjusted; August preliminary) rose 291,600 from the revised July numbers, while the number of unemployed dropped by 480,700. The reported unemployment rate improved 2.1 points to 11.4%. The unadjusted rate was off 7.4 points from the year earlier at 11.6%.
California had the 5th highest unemployment rate among the states.
Total US employment saw a seasonally adjusted gain of 3,756,000, with the number of unemployed dropping by 2,788,000. The reported unemployment rate dropped 1.8 points to 8.4%.
Figure Sources: California Employment Development Department; US Bureau of Labor Statistics
Labor Force Participation Rate Down to 59.9%
California’s seasonally adjusted labor force participation rate continued dropping to 59.9%. Nationally, the participation rate rose to 61.7%.
For the 12 months ending August 2020, the seasonally adjusted data shows the California labor force was down 710,900 workers (-3.7% loss) compared to the rest of the US loss of 2,345,100 (-1.0%). The reported unemployment rates also have to be viewed in the context that large numbers of workers no longer are in the labor force.
Employment Growth Ranking
The total number of persons employed (seasonally adjusted) over the 12 months ending in August plunged by 2,081,600. California had the lowest level among the states in terms of absolute employment loss over the year.
Adjusted to account for differences in the size of each state economy, California over the year showed an 11.2% contraction, far deeper than for the rest of the US with a loss of 6.1%. Ranked among the states, California had the 5th worst loss rate.
Figure Source: US Bureau of Labor Statistics
Nonfarm Jobs Up 101.9k
Nonfarm jobs (seasonally adjusted) rose 101,900, predominantly as a result of growth in Government hires both from temporary hires of Census workers and as school districts began making decisions on which teachers and other workers will return in the fall.
With the reported gains slowing, nonfarm jobs remained down 1,598,200 over the year. Adjusting for population, California loss rate edged down to 44th among the states. The 12-month jobs loss rate was -9.1% compared to the rest of the US at -6.5%.
Figure Sources: California Employment Development
Department; US Bureau of Labor Statistics
Jobs Change by Industry
In the unadjusted numbers that allow a more detailed look at industry shifts, all but 2 industries continued to post job losses over the 12-month period. Utilities as an essential service and Finance & Insurance with a high incidence of telework opportunities again were positive although largely unchanged.
Industries showing the greatest contractions over the year were led by Food Services, Arts, Entertainment & Recreation, and Retail Trade. For the month-to-month numbers, almost three-quarters of the net gains came from Government due largely to temporary hires of Census workers and to beginnings of the school year.
| Not Seasonally Adjusted Payroll Jobs (1,000) | August 2020 | 12-month change | Nonfarm Growth Rank | % 12-month Change | Avg. Annual Wage |
|---|---|---|---|---|---|
| Total Farm | 382.5 | -100.8 | -20.9% | $35.5k | |
| Mining & Logging | 22.0 | -1.1 | 3 | -4.8% | $119.5k |
| Construction | 860.8 | -49.8 | 11 | -5.5% | $72.5k |
| Manufacturing | 1,233.7 | -103.1 | 15 | -7.7% | $97.1k |
| Wholesale Trade | 657.8 | -37.7 | 8 | -5.4% | $80.4k |
| Retail Trade | 1,500.0 | -148.1 | 19 | -9.0% | $37.7k |
| Utilities | 57.0 | 0.5 | 2 | 0.9% | $137.0k |
| Transportation & Warehousing | 625.8 | -27.2 | 7 | -4.2% | $62.0k |
| Information | 516.2 | -48.2 | 10 | -8.5% | $188.7k |
| Finance & Insurance | 548.0 | 6.3 | 1 | 1.2% | $133.0k |
| Real Estate & Rental & Leasing | 291.1 | -14.9 | 4 | -4.9% | $71.2k |
| Professional, Scientific & Technical Services | 1,300.4 | -48.0 | 9 | -3.6% | $126.8k |
| Management of Companies & Enterprises | 240.8 | -15.1 | 5 | -5.9% | $135.1k |
| Administrative & Support & Waste Services | 1,041.2 | -105.5 | 16 | -9.2% | $47.3k |
| Educational Services | 331.6 | -26.5 | 6 | -7.4% | $56.0k |
| Health Care | 1,531.1 | -57.1 | 13 | -2.3% | $69.6k |
| Social Assistance | 789.5 | -56.3 | 12 | -6.7% | $20.9k |
| Arts, Entertainment & Recreation | 181.0 | -156.6 | 20 | -46.4% | $60.0k |
| Accommodation | 142.5 | -99.7 | 14 | -41.2% | $39.7k |
| Food Services | 1,092.6 | -390.9 | 21 | -26.3% | $24.1k |
| Other Services | 450.1 | -130.9 | 18 | -22.5% | $41.9k |
| Government | 2,384.2 | -116.6 | 17 | -4.7% | $72.0k |
| Total Nonfarm | 15,797.4 | -1,626.5 | -9.3% | ||
| Total Wage & Salary | 16,179.9 | -1,727.3 | -9.6% | ||
Figure Source: California Employment Development Department;
Wages based on most recent Quarterly Census of Employment & Wages
Unemployment Rates by Region (not seasonally adjusted)
Regions with jobs providing greater telework options—both due to the nature of the jobs and under the state’s regulations—including the Bay Area, Orange County, and Sacramento saw somewhat lower unemployment rates. Regions with higher concentrations of lower wage jobs including the Central Valley and Los Angeles had much higher rates.
| wdt_ID | Region | Unemployment Rates |
|---|---|---|
| 2 | California | 11.6 |
| 6 | Bay Area | 8.6 |
| 10 | Central Coast | 8.8 |
| 14 | Upstate California | 8.9 |
| 18 | Central Sierra | 9.0 |
| 22 | Sacramento | 9.4 |
| 26 | Orange County | 9.9 |
| 30 | San Diego/Imperial | 10.5 |
| 34 | Inland Empire | 11.0 |
| 38 | Central Valley | 11.8 |
| 39 | Los Angeles | 15.7 |
Figure Source: California Employment Development Department
Unemployment Rates by Legislative District (not seasonally adjusted)
Lowest
| wdt_ID | Congressional District | Unemployment Rate |
|---|---|---|
| 2 | CD18 (Eshoo-D) | 6.2 |
| 3 | CD17 (Khanna-D) | 7.4 |
| 4 | CD02 (Huffman-D) | 7.6 |
| 5 | CD52 (Peters-D) | 8.0 |
| 6 | CD24 (Carbajal-D) | 7.9 |
| 7 | CD49 (Levin-D) | 7.9 |
| 9 | CD04 (McClintock-R) | 8.1 |
| 10 | CD15 (Swalwell-D) | 8.3 |
| 12 | CD12 (Pelosi-D) | 8.3 |
| 13 | CD14 (Speier-D) | 8.4 |
| wdt_ID | Senate District | Unemployment Rate |
|---|---|---|
| 2 | SD13 (Hill-D) | 6.8 |
| 3 | SD01 (Dahle-R) | 7.7 |
| 4 | SD15 (Beall-D) | 8.0 |
| 5 | SD02 (McGuire-D) | 8.0 |
| 6 | SD39 (Atkins-D) | 8.2 |
| 7 | SD36 (Bates-R) | 8.3 |
| 8 | SD10 (Wieckowski-D) | 8.3 |
| 9 | SD17 (Monning-D) | 8.6 |
| 10 | SD03 (Dodd-D) | 8.7 |
| 11 | SD19 (Jackson-D) | 8.8 |
| wdt_ID | Assembly District | Unemployment Rate |
|---|---|---|
| 2 | AD28 (Low-D) | 6.4 |
| 3 | AD16 (Bauer-Kahan-D) | 6.6 |
| 4 | AD22 (Mullin-D) | 6.9 |
| 5 | AD24 (Berman-D) | 6.7 |
| 6 | AD04 (Aguiar-Curry-D) | 7.7 |
| 7 | AD10 (Levine-D) | 7.4 |
| 8 | AD25 (Chu-D) | 7.4 |
| 9 | AD06 (Kiley-R) | 7.2 |
| 10 | AD78 (Gloria-D) | 7.7 |
| 11 | AD77 (Maienschein-R) | 8.0 |
Highest
| wdt_ID | Congressional District | Unemployment Rate |
|---|---|---|
| 2 | CD30 (Sherman-D) | 15.6 |
| 3 | CD28 (Schiff-D) | 16.5 |
| 4 | CD32 (Napolitano-D) | 16.6 |
| 5 | CD29 (Cardenas-D) | 17.4 |
| 6 | CD51 (Vargas-D) | 17.1 |
| 7 | CD37 (Bass-D) | 16.7 |
| 9 | CD43 (Waters-D) | 17.6 |
| 10 | CD34 (Gomez-D) | 17.8 |
| 12 | CD40 (Roybal-Allard-D) | 19.4 |
| 13 | CD44 (Barragan-D) | 21.6 |
| wdt_ID | Senate District | Unemployment Rate |
|---|---|---|
| 2 | SD32 (Archuleta-D) | 14.2 |
| 3 | SD22 (Rubio-D) | 15.2 |
| 4 | SD14 (Hurtado-D) | 15.2 |
| 5 | SD18 (Hertzberg-D) | 17.4 |
| 6 | SD21 (Wilk-R) | 16.6 |
| 7 | SD40 (Hueso-D) | 15.5 |
| 9 | SD24 (Durazo-D) | 18.2 |
| 10 | SD33 (Gonzalez-D) | 18.7 |
| 12 | SD30 (Mitchell-D) | 18.7 |
| 13 | SD35 (Bradford-D) | 19.0 |
| wdt_ID | Assembly District | Unemployment Rate |
|---|---|---|
| 2 | AD53 (Santiago-D) | 16.7 |
| 3 | AD43 (Friedman-D) | 16.7 |
| 4 | AD48 (Rubio-D) | 16.9 |
| 5 | AD46 (Nazarian-D) | 19.1 |
| 6 | AD36 (Lackey-R) | 19.0 |
| 7 | AD62 (Burke-D) | 17.1 |
| 9 | AD63 (Rendon-D) | 20.2 |
| 10 | AD51 (Carrillo-D) | 20.5 |
| 12 | AD64 (Gipson-D) | 20.8 |
| 13 | AD59 (Jones-Sawyer-D) | 21.4 |
How Far Back Has the Economy in Each County Been Pushed?
As an indication of the severity of the current economic downturn, the following chart illustrates how much economic ground each county has lost using employment levels as the measure. Based on annual averages, the chart below indicates the last year each county saw the August employment numbers. Because the current series only goes back to 1990 for most counties, several of the entries indicate “Before 1990.” Los Angeles County is the exception, with data going back to 1976. The “Change” column indicates the change from April, the month reflecting the effects of the initial round of closures.
| wdt_ID | County | Last Year Employment Equal To or Less Than April | Last Year Employment Equal to or Less Than July | Change |
|---|---|---|---|---|
| 2 | Alameda County | 2009 | 2011 | 2 |
| 3 | Alpine County | 2009 | 2009 | 0 |
| 4 | Amador County | 1997 | 2012 | 15 |
| 5 | Butte County | 1998 | 1999 | 1 |
| 6 | Calaveras County | 2012 | 2014 | 2 |
| 7 | Colusa County | 1999 | 2012 | 13 |
| 8 | Contra Costa County | 1997 | 2011 | 14 |
| 9 | Del Norte County | 1992 | 1993 | 1 |
| 10 | El Dorado County | 1999 | 2013 | 14 |
| 11 | Fresno County | 2012 | 2015 | 3 |
| County | Last Year Employment Equal To or Less Than April | Last Year Employment Equal to or Less Than July | Change |
Employment Share by Region
The following chart compares change in employment (compared to pre-COVID February 2020) vs. population share as a measure of the disparate economic effects from the social distancing measures. Los Angeles Region, which experienced relatively greater job creation in lower income, population-serving and tourism industries during the recently ended expansion period, has to date sustained a commensurate far greater relative and absolute employment loss in the current economic downturn. Regions such as the Bay Area and San Diego with a greater incidence of jobs amenable to telework have been slightly less impacted. Regions such as the Central Valley and Inland Empire with a higher degree of essential businesses but also effects from seasonal factors have shown somewhat greater resiliency.
MSAs with the Worst Unemployment Rates: Los Angeles Remains at 9th Worst in Nation
The number of California MSAs among the 20 regions with the worst unemployment rates in July remained at four. As a result of a pattern of jobs growth in recent years that concentrated on the hardest-hit lower wage, population-serving and tourism service industries in Los Angeles County, Los Angeles-Long Beach-Anaheim MSA (Los Angeles and Orange Counties) remained at 9th worst in the nation for the second month in a row.
| wdt_ID | MSA | June Unemployment Rate | US Rank out of 389 |
|---|---|---|---|
| 1 | El Centro MSA | 26.8 | 389 |
| 2 | Los Angeles-Long Beach-Anaheim MSA | 16.8 | 381 |
| 3 | Bakersfield MSA | 16.5 | 380 |
| 4 | Visalia-Porterville MSA | 16.2 | 376 |