Highlights for policy makers:
- COVID-19 and the State Economy
- CaliFormer Businesses: Update
- Employment 1.037 Million Below Recovery
- Labor Force Participation Rate
- Nonfarm Jobs: 1.029 Million Below Recovery
- Jobs Change by Industry
- Employment Recovery by Region
- Unemployment Rates by Legislative Districts
- Unemployment Rates by Region
- MSAs with the Worst Unemployment Rates
COVID-19 and the State Economy
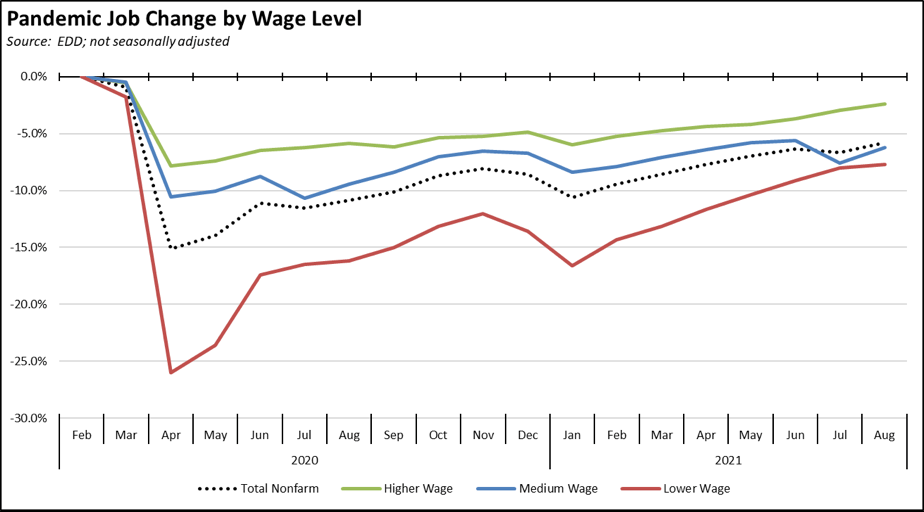
The August change in jobs by wage level showed the greatest change in the middle wage industries due to the heavy concentration coming from local government education. The lower-wage jobs recovery was substantially more shallow as the result of labor shortages combined with increasing concerns over the Delta variant. The higher-wage industries continued to experience the most consistent recovery rate.
In the chart, higher-wage jobs are those industries with average annual wages above $100,000; medium wage is $50,000 to $100,000; and lower wage is below $50,000. Job data is drawn from the industry classifications, unadjusted job numbers, and wage levels generally used in the regular report section below on Nonfarm Jobs.
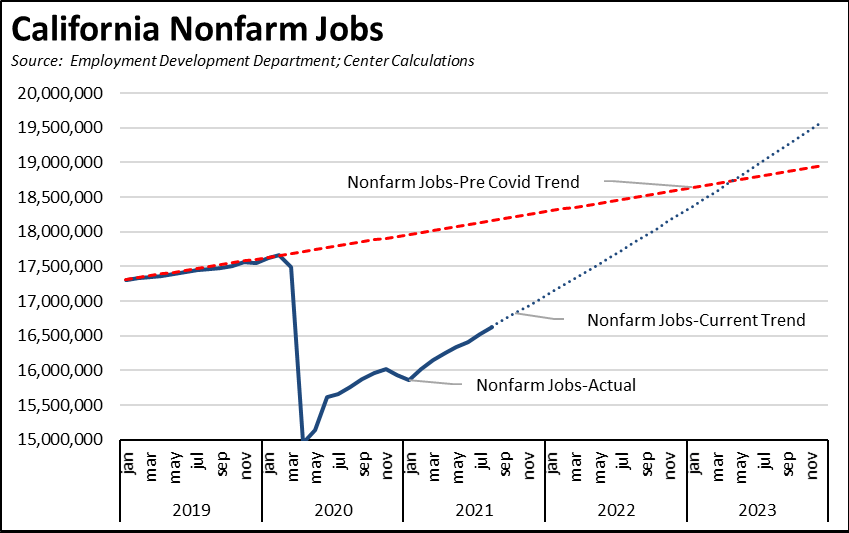
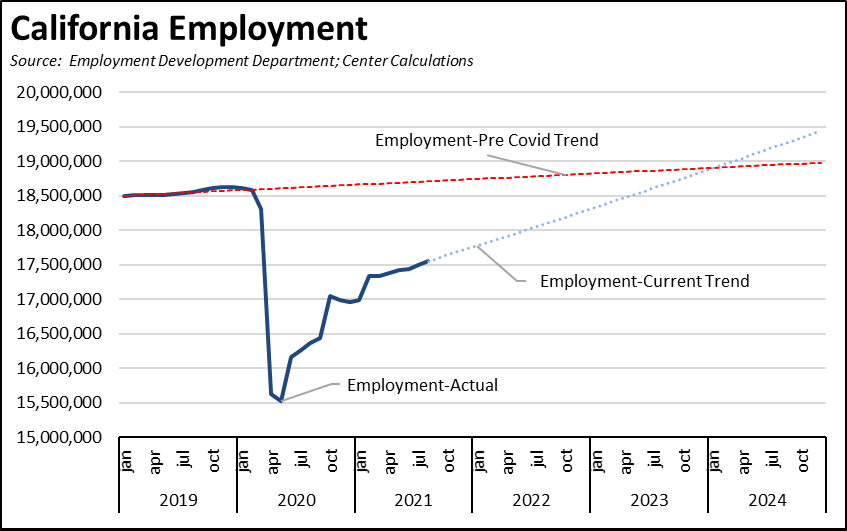
While both the jobs and employment numbers have been better in recent months, they are not yet at levels that would see quick recovery in the state economy. Continuing the rates experienced over the past 3 months would return nonfarm jobs to pre-Covid trend levels in mid-2023. The lagging recovery rate for employment would take an additional year.
In both charts, the pre-Covid trend is taken from the average monthly growth rate between January 2019 and February 2020. The Current Trend lines are calculated using the numbers from the last 3 months.
CaliFormer Businesses: Update
Additional CaliFormer companies identified since our last monthly report are as follows. These companies include those that have announced: (1) moving their headquarters or full operations out of state, (2) moving business units out of state (generally back office operations where the employees do not have to be in a more costly California location to do their jobs), (3) California companies that expanded out of state, and (4) companies turning to permanent telework options, leaving it to their employees to decide where to work and live.
| wdt_ID | Companies | From | To | Reason | Source | Year |
|---|---|---|---|---|---|---|
| 167 | 1Life Healthcare Inc. | San Francisco | Atlanta | Expansions | Read More | 2021 |
| 168 | Aatonomy | San Francisco | Houston | HQ move | Read More | 2018 |
| 169 | Abyss Creations | San Marcos | Las Vegas | HQ move | Read More | 2021 |
| 170 | Adlucent | Irvine | Austin | HQ move | Read More | 2019 |
| 171 | AFC Finishing Systems | Oroville | Idaho | HQ move | Read More | 2020 |
| 172 | AgencyKPI Inc. | Los Angeles | Austin | HQ move | Read More | 2020 |
| 173 | Aging 2.0 | San Francisco | Louisville | HQ move | Read More | 2020 |
| 174 | Airbrake Technologies | San Francisco | Austin | HQ move | Read More | 2020 |
| 175 | Alfresco Software Inc. | San Mateo | Massachusetts | HQ move | Read More | 2019 |
| 176 | Alpha Paw LLC | San Francisco | Austin | HQ move | Read More | 2021 |
| 177 | Alpine Technologies | Torrance | Michigan | HQ/manufacturing move | Read More | 2019 |
| 178 | Alto Pharmacy | San Francisco | Denver | HQ2 | Read More | 2018 |
| 179 | Andamiro USA Corp | Gardena | Texas | HQ move | Read More | 2021 |
| 180 | Anpac Bio | San Jose | Philadelphia | HQ move | Read More | 2019 |
| 181 | Aqua Metals Inc. | Alameda | Reno | HQ/manufacturing move | Read More | 2018 |
| 182 | Arcturus Aerospace | Oxnard | Arkansas | HQ/manufacturing move | Read More | 2020 |
| 183 | AtScale | San Mateo | Boston | HQ move | Read More | 2019 |
| 184 | Aviat Networks Inc. | Milpitas | Austin | HQ move | Read More | 2019 |
| 185 | Axiom Memory Solutions, Inc. | Irvine | Austin | HQ move | Read More | 2019 |
| 186 | Battle Motors Inc. | Venice | Ohio | EV truck manufacturing | Read More | 2021 |
| 187 | Bedrock Sandals | Richmond | Montana | HQ move | Read More | 2019 |
| 188 | BH North America | Los Angeles | Los Angeles | HQ move | Read More | 2018 |
| 189 | Callaway | Carlsbad | Salt Lake City | HQ move | Read More | 2020 |
| 190 | Canoo Inc. | Torrance | Texas, Oklahoma | EV manufacturing and HQ move | Read More | 2021 |
| 191 | Cicero Institute | San Francisco | Austin | HQ move | Read More | 2020 |
| 192 | Clean-Energy Corp. | Newport Beach | Texas | $1 billion solar power/battery manufacturing | Read More | 2021 |
| 193 | CodeBoxx | Sausalito | Florida | HQ move | Read More | 2021 |
| 194 | Cognito | Palo Alto | Oregon | HQ move | Read More | 2021 |
| 195 | Conner Logistics | Fresno | Kentucky | HQ move | Read More | 2021 |
| 196 | Crossfit LLC | Scotts Valley | Colorado | HQ move | Read More | 2020 |
| 197 | Daily Wire | Los Angeles | Nashville | HQ move | Read More | 2020 |
| 198 | DIQ SEO | Silicon Valley | Texas | HQ move | Read More | 2021 |
| 199 | DMG | Newport Beach | Ohio | HQ move | Read More | 2021 |
| 200 | EnerBlu Inc. | Riverside | Kentucky | HQ move | Read More | 2018 |
| 201 | Fantic USA | Sausalito | Denver | HQ move | Read More | 2019 |
| 202 | Flatirons Solutions | Irvine | Colorado | HQ move | Read More | 2018 |
| 203 | Fox Factory | Scotts Valley | Georgia | HQ/manufacturing move | Read More | 2018 |
| 204 | Ganymede Games | Alameda | New Mexico | HQ move | Read More | 2019 |
| 205 | GetSales | San Francisco | Austin | HQ move | Read More | 2018 |
| 206 | Gilad & Gilad | Los Angeles | Texas | HQ move | Read More | 2018 |
| 207 | Glock Store | San Diego | Nashville | HQ move | Read More | 2018 |
| 208 | Grinds LLC | Oakland | Indiana | HQ/manufacturing move | Read More | 2019 |
| 209 | GrowthPlug | San Jose | Oregon | HQ move | Read More | 2019 |
| 210 | GuineaDad | Los Angeles | North Las Vegas | HQ move | Read More | 2020 |
| 211 | H.E.R.O.S. Inc. | Santa Clarita | Arizona | HQ move | Read More | 2019 |
| 212 | Hall Technologies | Tustin | Texas | HQ and manufacturing move | Read More | 2021 |
| 213 | Haptx / Axon VR | San Luis Obispo | Washington | HQ move | Read More | 2021 |
| 214 | Honor Home Care (HQ2) | Concord | Austin | Second operations center | Read More | 2018 |
| 215 | Iron Ox | San Carlos | Texas | Second expansion | Read More | 2021 |
| 216 | IT Avalon | Brentwood | Reno | HQ move | Read More | 2021 |
| 217 | Joe Rogan Experience | Los Angeles | Austin | HQ move | Read More | 2020 |
| 218 | JRS Company | Covina | Texas | HQ/manufacturing move | Read More | 2018 |
| 219 | Juul Labs | San Francisco | DC | HQ move | Read More | 2020 |
| 220 | Keen Horse Training | Arcadia | Texas | HQ move | Read More | 2020 |
| 221 | Kinwoven | San Diego | Oklahoma | HQ move | Read More | 2020 |
| 222 | Lockheed Martin FBM | Sunnyvale | Florida | HQ move | Read More | 2019 |
| 223 | Lucid Group | Newark | Arizona | EV manufacturing expansion | Read More | 2021 |
| 224 | Maxar Technologies | San Francisco | Colorado | HQ move | Read More | 2018 |
| 225 | Miro | San Francisco | Austin | Expansion | Read More | 2021 |
| 226 | Misfits Gaming Group | Los Angeles | Louisiana | HQ move | Read More | 2020 |
| 227 | Montrose Environmental Group | Irvine | Arkansas | HQ move | Read More | 2021 |
| 228 | Mullen Technologies | Brea | Tennessee | 1.2 million sf ev manufacturing expansion | Read More | 2021 |
| 229 | Mutual UFO Network (MUFON) | Los Angeles | Cincinnati | HQ move | Read More | 2021 |
| 230 | National Hot Rod Association | Glendora | Indiana | HQ move | Read More | 2021 |
| 231 | Nexen Tire | Diamond Bar | Ohio | HQ move | Read More | 2021 |
| 232 | Nintendo | Redwood City | Washington/British Columbia | Consolidation | Read More | 2021 |
| 233 | OKIN BPS | Mountain View | San Antonio | HQ move | Read More | 2018 |
| 234 | Old Gringo Boots | San Diego | Fort Worth | HQ move | Read More | 2021 |
| 235 | Optimal Elite Management LLC | Santa Clara | Austin | HQ/manufacturing move | Read More | 2020 |
| 236 | PerceptIn | Santa Clara | Indiana | HQ move | Read More | 2019 |
| 237 | Plumas Bancorp | Quincy | Reno | HQ move | Read More | 2021 |
| 238 | Premier Displays & Exhibits Inc. | Cypress | Las Vegas | HQ move | Read More | 2019 |
| 239 | Prenexus Health | Brawley | Arizona | HQ/manufacturing move | Read More | 2018 |
| 240 | Promises Behavioral Health | Long Beach | Tennessee | HQ move | Read More | 2019 |
| 241 | Puroast Coffee Co. Inc. | Woodland | North Carolina | HQ move | Read More | 2021 |
| 242 | QQE Summit LLC | Newark | Ohio | HQ move/manufacturing expansion | Read More | 2020 |
| 243 | Quetico, LLC | Chino | Arizona | HQ/logistics center move | Read More | 2019 |
| 244 | RaceChip | Brea | Florida | HQ move | Read More | 2019 |
| 245 | Regroup Mass Notification | San Francisco | Dallas | HQ move | Read More | 2020 |
| 246 | RiceBran Technologies | West Sacramento | Houston | HQ move | Read More | 2018 |
| 247 | Samsung (revised) | San Jose | Texas | $17 billion chip-making plant | Read More | 2021 |
| 248 | Scollar | Santa Rosa | Kansas City | HQ move | Read More | 2019 |
| 249 | Shmoop University, Inc. | Mountain View | Arizona | HQ move | Read More | 2019 |
| 250 | ShutterFly, Inc. (HQ2) | Redwood City | Minnesota | HQ2 | Read More | 2020 |
| 251 | Simwon America Corp. | Lathrop | Texas | EV parts manufacturing | Read More | 2021 |
| 252 | Smartrise Engineering | Sacramento | Texas | HQ move | Read More | 2018 |
| 253 | Smarty-Pits | Tehachapi | Oregon | HQ move | Read More | 2021 |
| 254 | Solvd Health | Carlsbad | Chicago | HQ move | Read More | 2021 |
| 255 | Space Channel Inc. | Los Angeles | Texas | HQ move | Read More | 2021 |
| 256 | Suzuki Marine USA | Brea | Florida | HQ move | Read More | 2021 |
| 257 | Synergy Blue | Palm Desert | Las Vegas | HQ move | Read More | 2019 |
| 258 | Tachyum | San Jose | Nevada | HQ move | Read More | 2020 |
| 259 | Tailift Material Handling USA | Ontario | Houston | HQ move | Read More | 2021 |
| 260 | TCS Healthcare Technologies | Auburn | North Carolina | HQ move | Read More | 2021 |
| 261 | theBalm | Alameda | Reno | HQ move and distribution facility expansion | Read More | 2020 |
| 262 | TV4 Entertainment | Venice | Florida | HQ move | Read More | 2019 |
| 263 | Unstoppable Domains | San Francisco | Reno | HQ move | Read More | 2020 |
| 264 | Upstart Network Inc. (HQ2) | San Carlos | Ohio | HQ2 | Read More | 2019 |
| 265 | UroDev Medical | San Clemente | Minnesota | HQ move | Read More | 2021 |
| 266 | Waterlogic USA, Inc. | Concord | Texas | HQ move | Read More | 2019 |
| 267 | Weatherby Inc. | Paso Robles | Wyoming | HQ/manufacturing move | Read More | 2019 |
| 268 | Weiss Watch Co. | Torrance | Nashville | HQ/manufacturing move | Read More | 2020 |
| 269 | William Glen Inc. | Sacramento | Texas | HQ move | Read More | 2021 |
| 270 | Woodward Inc. | Duarte | Colorado | HQ/manufacturing move | Read More | 2018 |
| 271 | Xos Inc. | Glassell Park | Tennessee | EV truck manufacturing; battery manufacturing | Read More | 2020 |
| 272 | Yeezy | Calabasas | Wyoming | HQ move | Read More | 2020 |
| 273 | Zeiss Vision Care | San Diego | Kentucky | HQ move | Read More | 2021 |
| Companies | From | To | Reason | Source | Year |
Employment 1.037 Million Below Recovery
EDD reported that employment (seasonally adjusted; August preliminary) was up 57,500 from the revised July numbers, while the number of unemployed was largely unchanged with a drop of only 2,200. The unadjusted numbers show a loss of 57,300 after a more solid gain of 178,400 in July.
The reported unemployment rate improved 0.1 point to 7.5% due to a 0.3% expansion in the labor force, compared to 4.3% in February 2020 prior to the pandemic. California’s seasonally adjusted unemployment rate was the 2nd highest among the states, exceeding only Nevada.
The national results again were somewhat stronger, with total US employment rising by 509,000, and the number of unemployed dropping by 318,000. The reported unemployment rate improved 0.2 point to 5.2%, compared to 3.5% in February 2020.
Figure Sources: California Employment Development Department; US Bureau of Labor Statistics
In the seasonally adjusted numbers, California employment remains 1.037 million (5.6%) below the pre-pandemic level in February 2020; the rest of the states combined were 3.2% below. California was the 10th lowest ranked by employment recovery level, while 9 states were above the pre-pandemic February 2020 employment levels.
Labor Force Participation Rate
The labor force participation rate edged up 0.1 point to 61.0%, while the US number was unchanged at 61.7%. The California rate remains well below the pre-pandemic level of 62.5%, which in turn was down substantially from prior years. Accounting for workers leaving the workforce since February 2020, there were 1.9 million out of work in August.
Nonfarm Jobs: 1.029 Million Below Recovery
Nonfarm wage and salary jobs were up 104,300 (seasonally adjusted) in August, while gains in July were revised 1,300 lower. Of the total, 58% was due to government hires, mostly coming from seasonal factors related to schools but also with non-education hires rising due to historically high public revenues. Nonfarm jobs nationally were up 235,000.
Compared to the February 2020 numbers (seasonally adjusted) just prior to the pandemic, nonfarm wage and salary jobs in California were 1.029 million short of recovery, or 19.3% of the national shortfall. California tied with New Mexico and Rhode Island for the 10th lowest rate of jobs recovery.
In the seasonally adjusted numbers, two states—Utah and Idaho—continue to exceed the pre-pandemic levels, moving from recovery to growth.
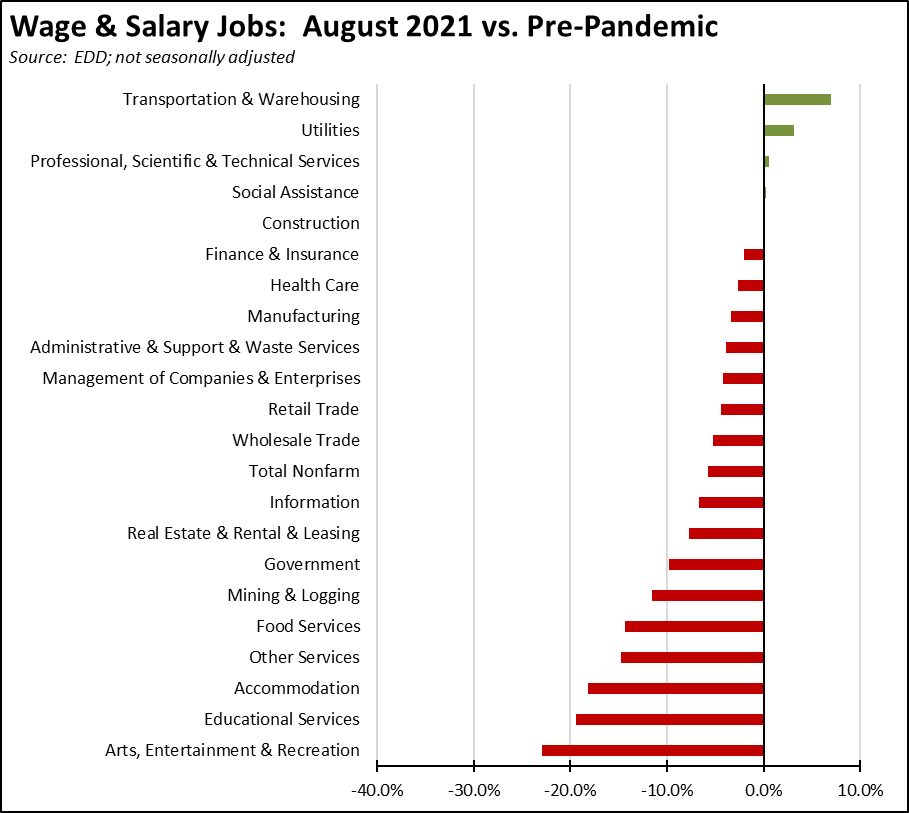
Jobs Change by Industry
Using the unadjusted numbers that allow a more detailed look at industry shifts, 5 industries showed job levels at or exceeding the pre-pandemic February 2020 levels. The strongest lags in recovery continue to those lower-wage industries that were hardest hit by the state-ordered closures: Arts, Entertainment & Recreation, Accommodation, Other Services, and Food Services. The relative levels of Government and Educational Services continue to be affected by seasonal factors as schools began reopening in August.
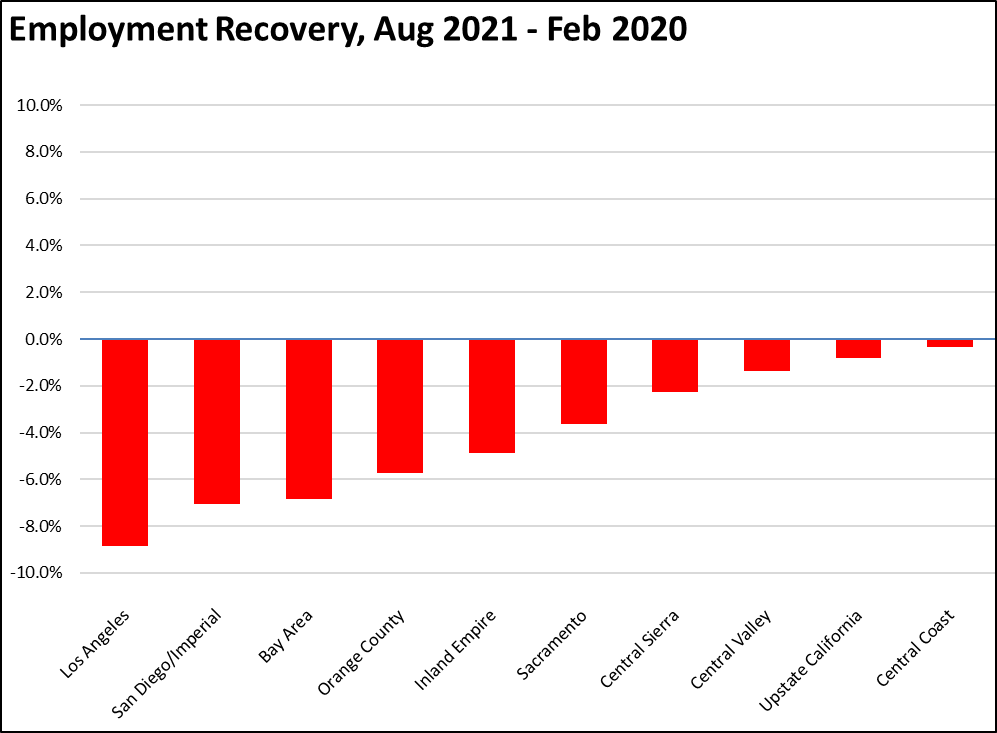
Employment Recovery by Region
Comparing August employment to pre-pandemic February 2020, Los Angeles Region lagged behind the rest of the state in employment recovery, showing a loss of 8.9% and containing 43% of the total employment shortfall in the state compared to 29% of the total population.
Unemployment Rates by Legislative Districts
The highest and lowest estimated unemployment rates in August are shown below.
Lowest
| wdt_ID | Congressional District | Unemployment Rate |
|---|---|---|
| 2 | CD18 (Eshoo-D) | 3.0 |
| 3 | CD17 (Khanna-D) | 3.7 |
| 4 | CD02 (Huffman-D) | 4.1 |
| 5 | CD52 (Peters-D) | 4.1 |
| 6 | CD12 (Pelosi-D) | 3.8 |
| 7 | CD14 (Speier-D) | 3.9 |
| 9 | CD15 (Swalwell-D) | 4.1 |
| 10 | CD19 (Lofgren-D) | 4.3 |
| 12 | CD49 (Levin-D) | 4.3 |
| 13 | CD45 (Porter-D) | 4.3 |
| wdt_ID | Senate District | Unemployment Rate |
|---|---|---|
| 2 | SD13 (Hill-D) | 3.3 |
| 3 | SD15 (Beall-D) | 3.8 |
| 4 | SD11 (Wiener-D) | 4.0 |
| 5 | SD10 (Wieckowski-D) | 4.1 |
| 6 | SD36 (Bates-R) | 4.2 |
| 7 | SD01 (Dahle-R) | 4.5 |
| 8 | SD39 (Atkins-D) | 4.3 |
| 9 | SD02 (McGuire-D) | 4.4 |
| 10 | SD37 (Moorlach-R) | 4.3 |
| 11 | SD17 (Monning-D) | 4.9 |
| wdt_ID | Assembly District | Unemployment Rate |
|---|---|---|
| 2 | AD28 (Low-D) | 3.0 |
| 3 | AD24 (Berman-D) | 3.3 |
| 4 | AD22 (Mullin-D) | 3.3 |
| 5 | AD16 (Bauer-Kahan-D) | 3.6 |
| 6 | AD73 (Brough-R) | 4.0 |
| 7 | AD10 (Levine-D) | 4.0 |
| 8 | AD06 (Kiley-R) | 3.9 |
| 9 | AD25 (Chu-D) | 3.8 |
| 10 | AD17 (Chiu-D) | 3.8 |
| 11 | AD78 (Gloria-D) | 4.1 |
Highest
| wdt_ID | Congressional District | Unemployment Rate |
|---|---|---|
| 2 | CD29 (Cardenas-D) | 7.8 |
| 3 | CD37 (Bass-D) | 7.9 |
| 4 | CD28 (Schiff-D) | 8.0 |
| 5 | CD34 (Gomez-D) | 8.7 |
| 6 | CD16 (Costa-D) | 8.9 |
| 7 | CD32 (Napolitano-D) | 7.9 |
| 9 | CD21 (Cox-D) | 9.5 |
| 10 | CD40 (Roybal-Allard-D) | 9.5 |
| 12 | CD51 (Vargas-D) | 10.6 |
| 13 | CD44 (Barragan-D) | 10.6 |
| wdt_ID | Senate District | Unemployment Rate |
|---|---|---|
| 2 | SD22 (Rubio-D) | 7.1 |
| 3 | SD12 (Caballero-D) | 7.4 |
| 4 | SD21 (Wilk-R) | 8.5 |
| 5 | SD35 (Bradford-D) | 8.8 |
| 6 | SD24 (Durazo-D) | 8.8 |
| 7 | SD18 (Hertzberg-D) | 7.9 |
| 9 | SD30 (Mitchell-D) | 9.0 |
| 10 | SD33 (Gonzalez-D) | 9.1 |
| 12 | SD40 (Hueso-D) | 9.4 |
| 13 | SD14 (Hurtado-D) | 10.4 |
| wdt_ID | Assembly District | Unemployment Rate |
|---|---|---|
| 2 | AD46 (Nazarian-D) | 8.8 |
| 3 | AD31 (Arambula-D) | 9.3 |
| 4 | AD36 (Lackey-R) | 9.2 |
| 5 | AD63 (Rendon-D) | 9.8 |
| 6 | AD32 (Salas-D) | 9.6 |
| 7 | AD26 (Mathis-R) | 9.0 |
| 9 | AD51 (Carrillo-D) | 9.9 |
| 10 | AD64 (Gipson-D) | 10.3 |
| 12 | AD59 (Jones-Sawyer-D) | 10.4 |
| 13 | AD56 (Garcia-D) | 11.3 |
Unemployment Rates by Region
Unemployment rates (not seasonally adjusted) compared to pre-pandemic February 2020 continue to show Los Angeles Region with the worst outcome in the state.
| wdt_ID | Region | August - 21 | Feb - 20 |
|---|---|---|---|
| 2 | California | 6.4 | 4.3 |
| 6 | Bay Area | 4.6 | 2.7 |
| 10 | Orange County | 5.0 | 7.0 |
| 14 | Central Coast | 5.3 | 4.6 |
| 18 | Sacramento | 5.5 | 4.5 |
| 22 | Central Sierra | 5.5 | 8.4 |
| 26 | Upstate California | 5.9 | 2.8 |
| 30 | San Diego/Imperial | 6.1 | 3.9 |
| 34 | Inland Empire | 6.6 | 3.7 |
| 38 | Los Angeles | 7.9 | 6.3 |
| 39 | Central Valley | 8.0 | 3.8 |
Figure Source: California Employment Development Department
MSAs with the Worst Unemployment Rates
California had 11 of the MSAs among the 25 regions with the worst unemployment rates in July.
| wdt_ID | MSA | July Unemployment Rate | US Rank out of 389 |
|---|---|---|---|
| 1 | El Centro MSA | 18.1 | 389 |
| 2 | Visalia-Porterville MSA | 9.3 | 387 |
| 3 | Bakersfield MSA | 8.7 | 385 |
| 4 | Merced MSA | 8.2 | 384 |
| 5 | Hanford-Corcoran MSA | 8.0 | 380 |
| 6 | Fresno MSA | 7.8 | 379 |
| 7 | Stockton-Lodi MSA | 7.5 | 376 |
| 8 | Los Angeles-Long Beach-Anaheim MSA | 7.4 | 374 |
| 9 | Madera MSA | 7.3 | 372 |
| 10 | Yuba City MSA | 7.2 | 371 |
| 11 | Modesto MSA | 6.9 | 365 |