The Center for Jobs and the Economy has released our initial analysis of the April labor force and jobs data. For additional information and data about the California economy visit www.centerforjobs.org/ca.
Nonfarm Jobs Edge Down 3,300
In the preliminary numbers, seasonally adjusted nonfarm jobs showed little change with a loss of only 3,300. Year-to-date, nonfarm jobs now show a gain of 101,500 (0.6%) compared with the overall US gain of 0.2%. Coming after January’s high seasonal adjustment factor and the strike-affected February and March results, the April estimate is the first normalized result for the year.
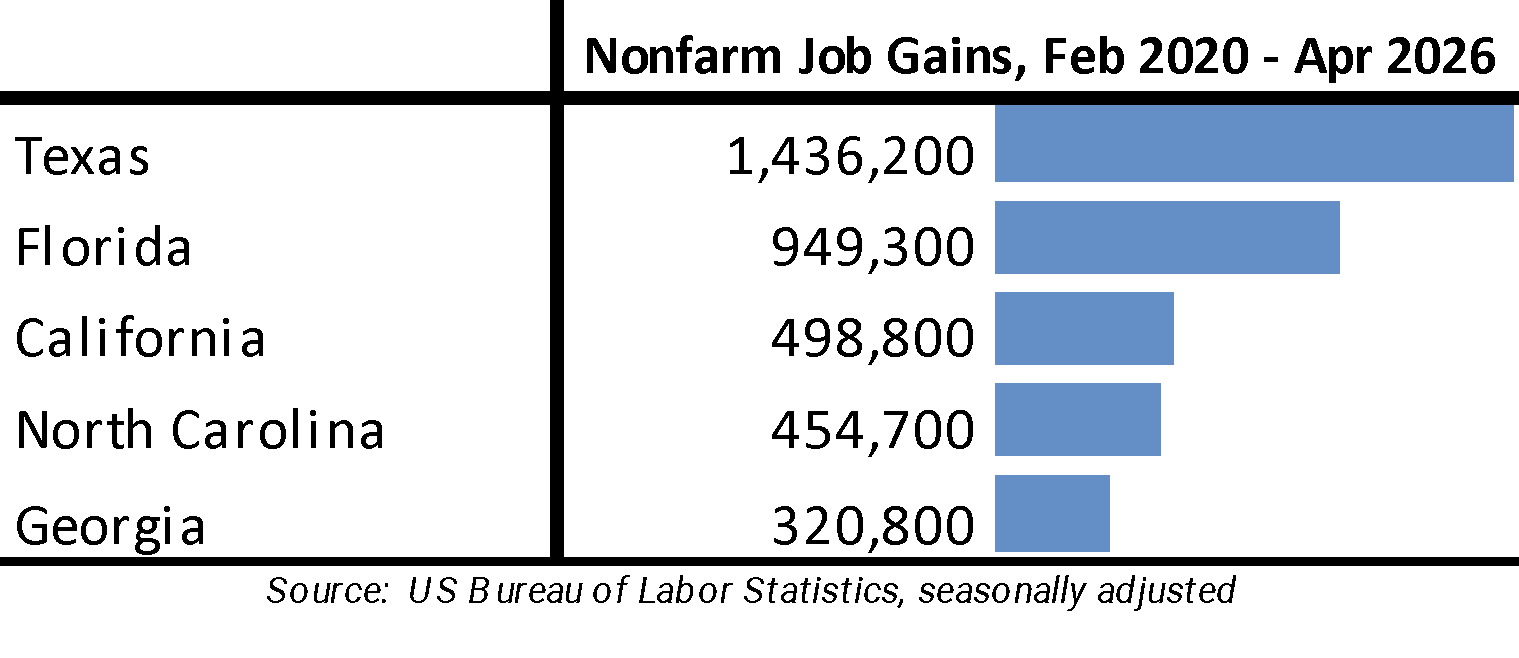
The April preliminary result was the 2nd worst among the states, ahead of only New York. Job gains were led by Florida with 40,500 followed by North Carolina with 16,000 and Minnesota at 15,900.
Looking at net total nonfarm job gains compared to pre-pandemic peaks, California remained in 3rd place only somewhat ahead of much smaller North Carolina.
By industry, job gains came from government and government-supported Health Care & Social Assistance, with the Other Private industries on net contracted for the month and were largely unchanged for the year. Within the Other Private industries, gains over the year were heavily concentrated in lower wage Accommodation & Food Services, while contractions were in higher wage Information, Manufacturing, and construction.
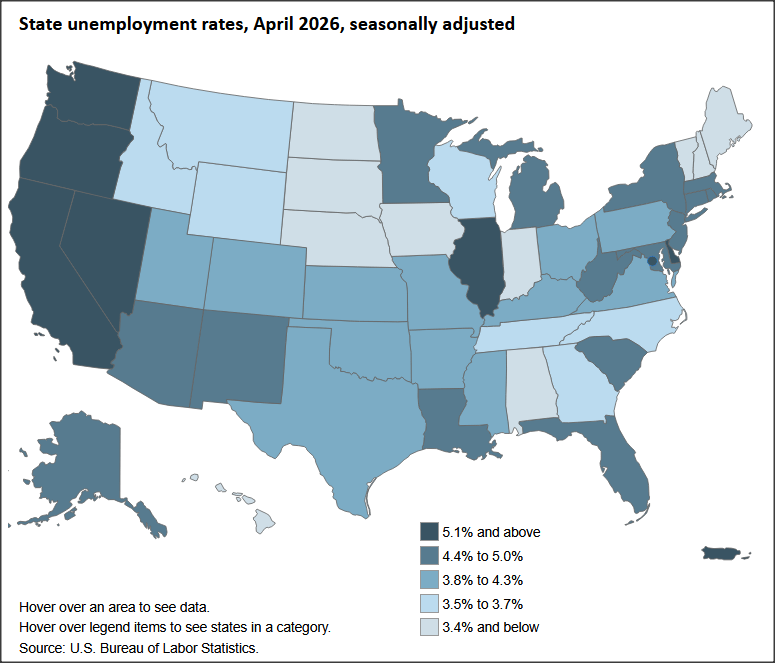
California Unemployment Rate Tied for Highest Among the States
California Unemployment
Employment fell by 42,600 (seasonally adjusted) in the preliminary estimate and was down 41,100 for the year.
Nationally, total employment was down 266,000 in the preliminary estimate for the month, and off 1.3 million for the year.
California labor force (seasonally adjusted) edged down by 50,100, with the labor force participation rate level falling 0.2 point to 62.1%. The US labor force was little changed with a loss of 92,000, pushing the participation rate down 0.1 point to 61.8%.
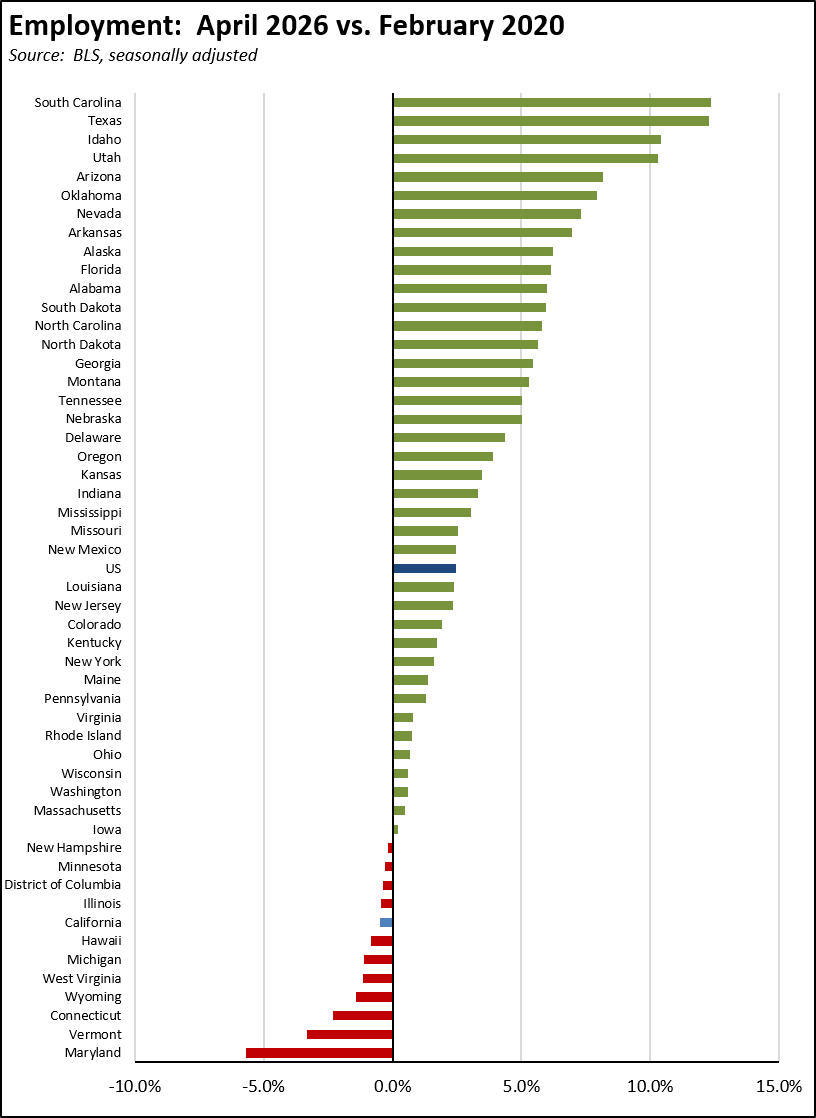
Employment Recovery Progress
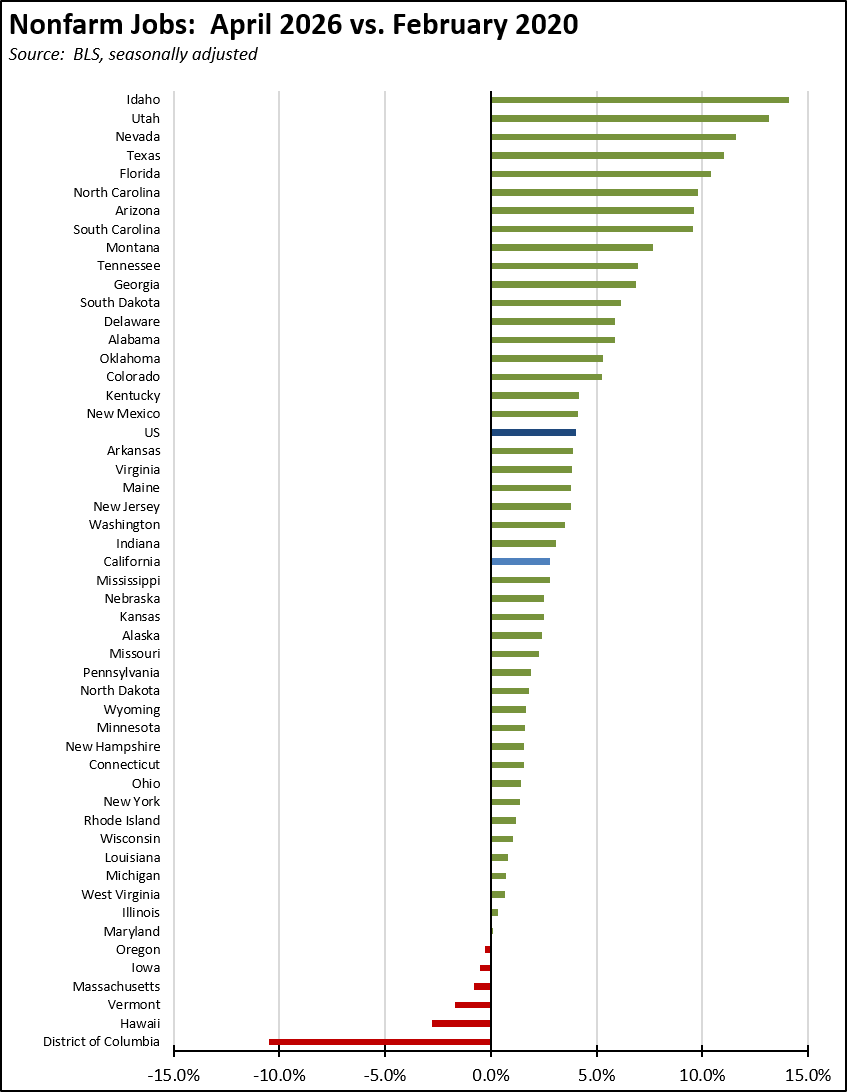
Due to the weak labor force numbers, California again remained just shy of recovery to its pre-pandemic employment levels. Adjusted by size, California’s performance edged down to 44th worst among the states and DC. As indicated in the chart, states with lower tax and lower regulatory burdens—including several adopting lower individual and business tax rates in recent years—have been far more successful in expanding employment opportunities for their populations.
Nonfarm Jobs
Nonfarm wage and salary jobs (seasonally adjusted) were essentially unchanged with a loss of 3,300, while March was revised up by 8,800 to a gain of 37,500, largely reflecting the end of the strikes that affected the February numbers. For the US as a whole, nonfarm jobs rose 115,000 in the April preliminary estimate.
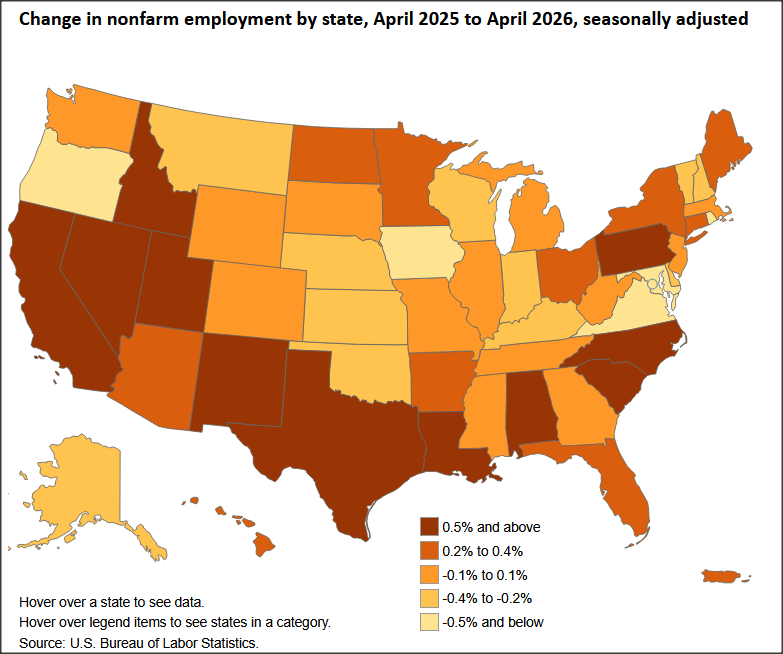
Recovery Progress: CA Nonfarm Jobs vs. Other States
Interactive original: https://www.bls.gov/charts/state-employment-and-unemployment/state-unemployment-rates-map.htm
California’s monthly job performance in April was the second worst among the states and DC. Adjusted for size, California’s recovery level compared to the pre-pandemic peaks remained the 25th highest, while only 5 states and DC have yet to show positive recovery.
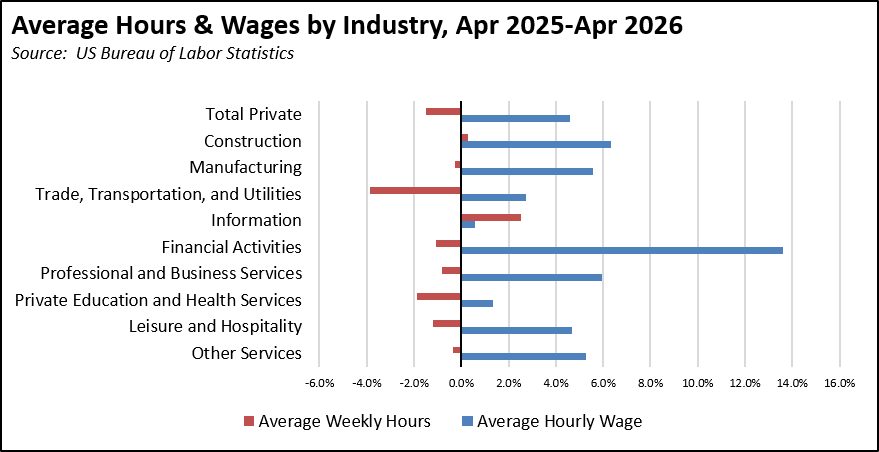
Wages & Hours
In the seasonally unadjusted data, private average hourly wage rose 4.6% over the year, ranging from 0.6% in Information to 13.6% in Financial Activities. These higher labor costs, however, continued to be partially offset by a reduction in average weekly hours in most industries, with an overall loss of 1.5% for all private sector jobs. Combined with further offsets coming from 3.8% inflation in this period, as measured by US CPI, weekly earnings saw little real gain over the year.
Unemployment Rates by Region
Unemployment rates (not seasonally adjusted) were higher in all regions compared to pre-pandemic February 2020 levels other than the Central Coast, Upstate California, and Central Valley.
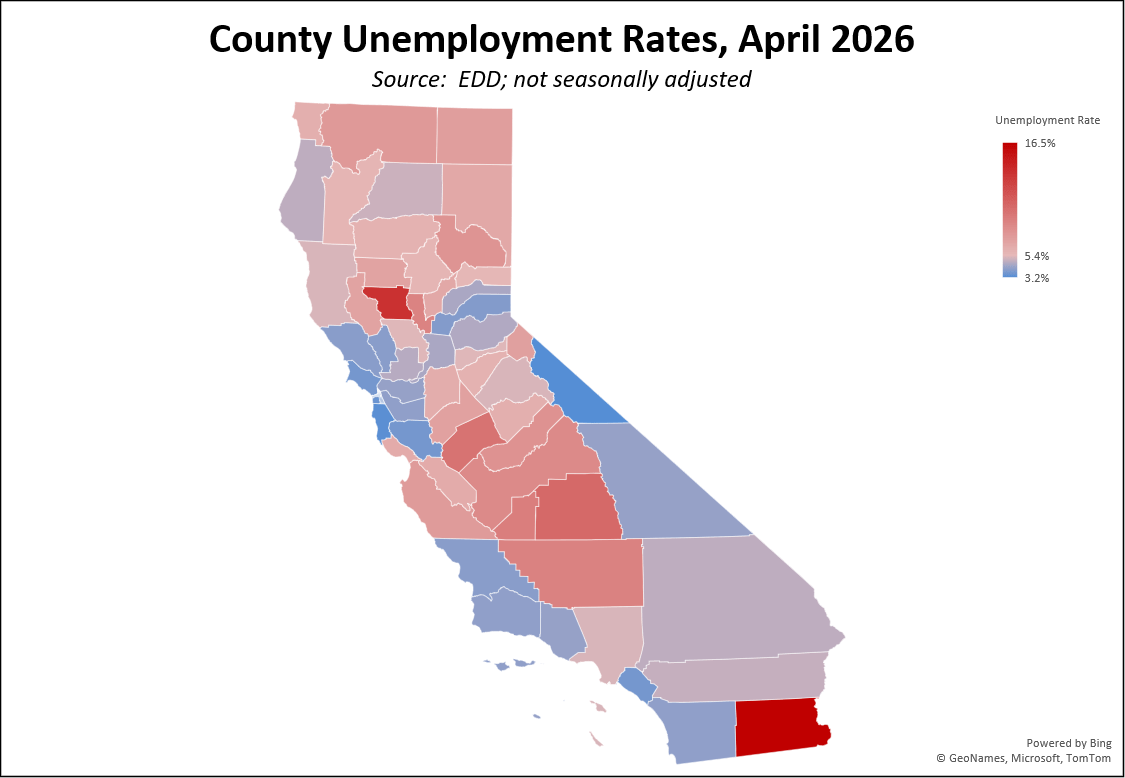
Counties with Double-Digit Unemployment
The number of counties with an unemployment rate (not seasonally adjusted) at 10% was at only 3. The unadjusted rates ranged from 3.2% in Mono to 16.5% in Imperial.
Unemployment Rate by Legislative District
The number of counties with an unemployment rate (not seasonally adjusted) at 10% was at only 3. The unadjusted rates ranged from 3.2% in Mono to 16.5% in Imperial.