The Center for Jobs and the Economy has released our initial analysis of the December employment and labor force data. The EDD and BLS releases are again on different schedules. Data for the other states will be addressed in our Full Jobs Report after it is released by Bureau of Labor Statistics next week. For additional information and data about the California economy visit www.centerforjobs.org/ca. Note that the data begins to reflect the annual revision process, with the US labor force numbers revised beginning in January 2021. The job numbers will be revised beginning with the release of January 2026 estimates.
Nonfarm Jobs Edge Down 1,700 in the Preliminary Estimate; 11,200 Loss for the Year
Nonfarm wage and salary jobs (seasonally adjusted) edged down 1,700 in the preliminary estimate for December. November’s gains were lowered by 2,000 to 30,500. For the year, the preliminary December numbers bring the total loss in 2025 to 11,200. All of these numbers are subject to further change in the upcoming annual revisions.
Regardless of the final revisions, the jobs data continues to indicate the state’s economy has essentially stalled, and these conditions have existed well before this year’s tariff and immigration enforcement actions. Compared to the previous peak in January 2024, the preliminary numbers indicate nonfarm jobs have only grown by only 11,200.
By industry, jobs growth continued to be dominated by government and government-supported Healthcare & Social Assistance. Other private industries saw a loss of 12,900 for the month and 181,700 for the year. Combined, the other private industries have contracted by 432,900 jobs since their peak in September 2022.
Most of this year saw little change in the number of federal jobs, but many of the reductions—both voluntary and otherwise—became effective with the new federal fiscal year beginning in October. Compared to December 2024, the number of federal jobs in the state dropped by 16,500, with the government gains shown in the table below predominately coming from local government hiring.
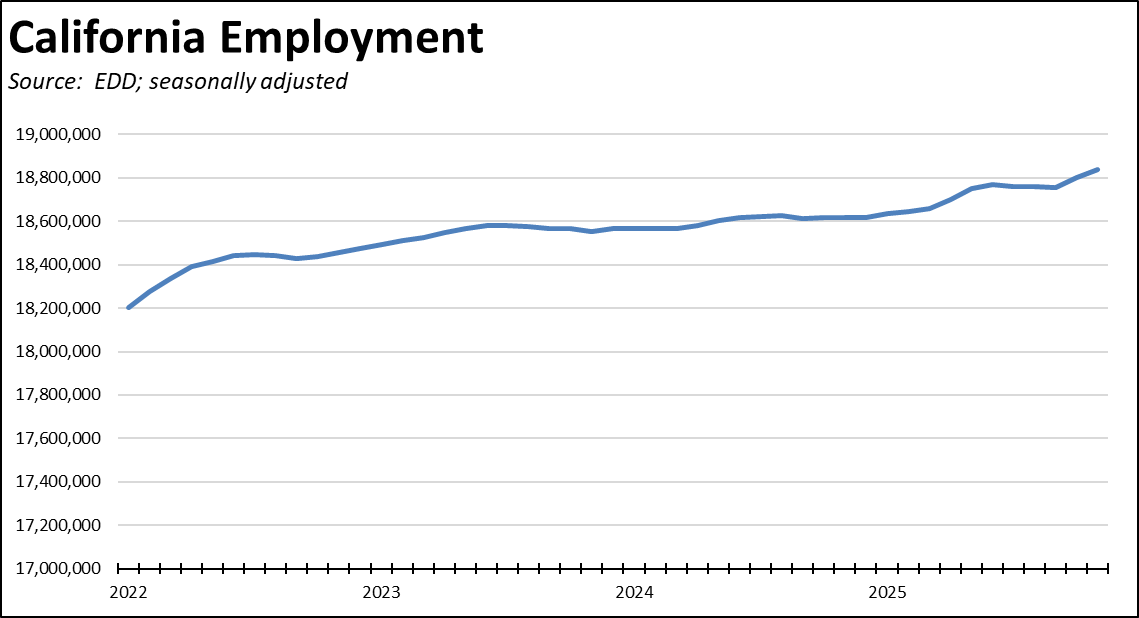
Total employment grew by 37,800 in the preliminary numbers for December, remaining above the pre-pandemic highs in early 2020 but by only 71,100.
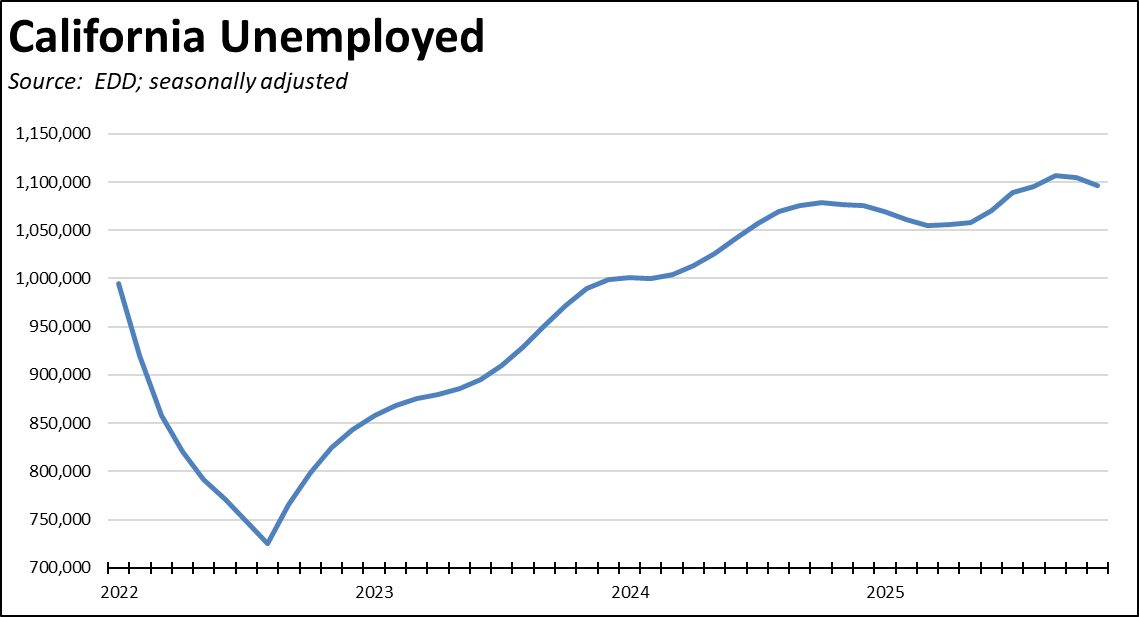
The total number of unemployed improved by only 8,800, remaining above the 1 million mark for the 24th month in a row.
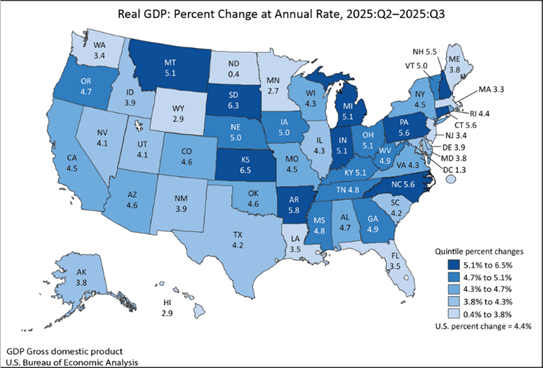
Real GDP Up 4.5% in Q3
On an annualized basis, California Real GDP grew by 4.5% in Q3, marginally higher than the US average of 4.4%. California’s growth rate was the 26th highest among the states, which were led by Kansas (6.5%), South Dakota (6.3%), and Arkansas (5.8%).
Compared to the pre-pandemic high, California Real GDP) continues to lag behind the US average, growing by 12.9% compared to the US at 14.5%.
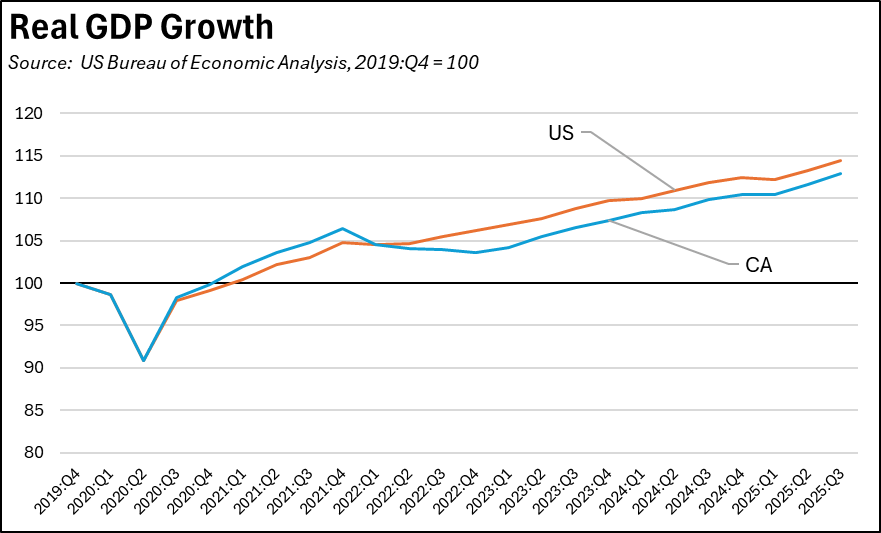
The GDP numbers again reflect California’s dependence on the tech industry for its economic performance. Tech-containing Information and Professional, Scientific, and Technical Services accounted for 37.6% of California’s Real GDP growth, compared to 24.5% in the US average.
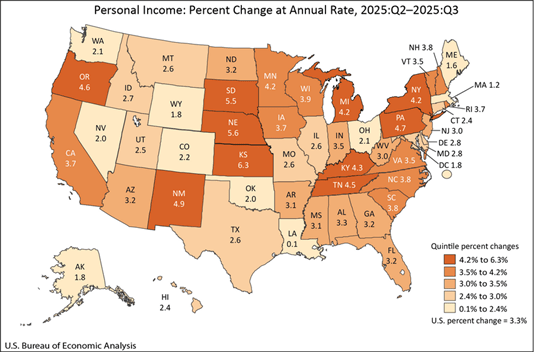
Personal Income Up 3.7% in Q3
On an annualized basis, California Personal Income grew by 3.7% in Q3, higher than the US average of 3.3%. California’s growth rate was the 17th highest among the states, which were led by South Dakota (7.4%), Kansas (6.3%), and North Dakota (6.5%). California’s Personal Income in Q3 was 0.9% lower than the level estimated in the Department of Finance projections underlying the recently released Proposed Budget for 2026-27.
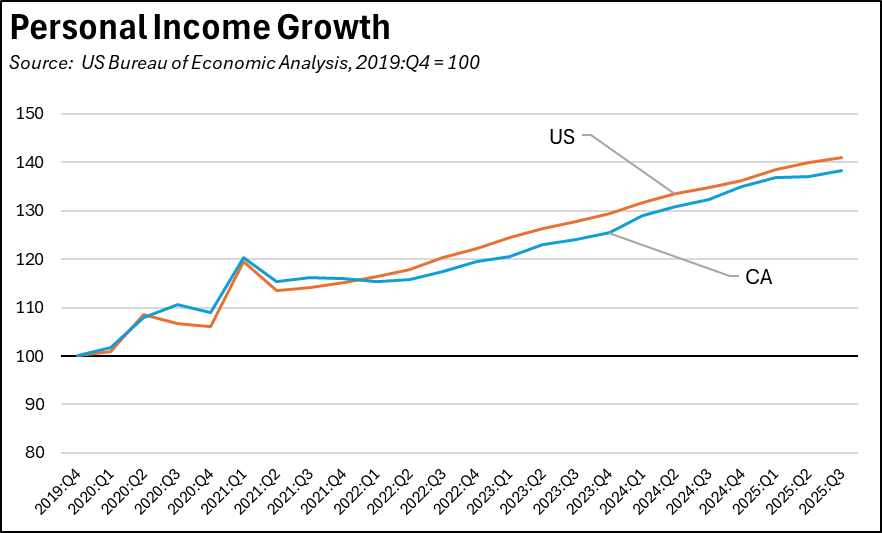
Compared to the per-pandemic high, California personal income growth has only been marginally lower than the US average, growing by 38.3% compared to the US at 41.0%. While Tech industry compensation provides a significant boost to the California numbers, this factor has been countered by population shrinkage. Nonetheless, the gap began to disappear in 2024, but has since begun to widen in the new and revised numbers for 2025.
California Labor Force
Nonfarm Jobs
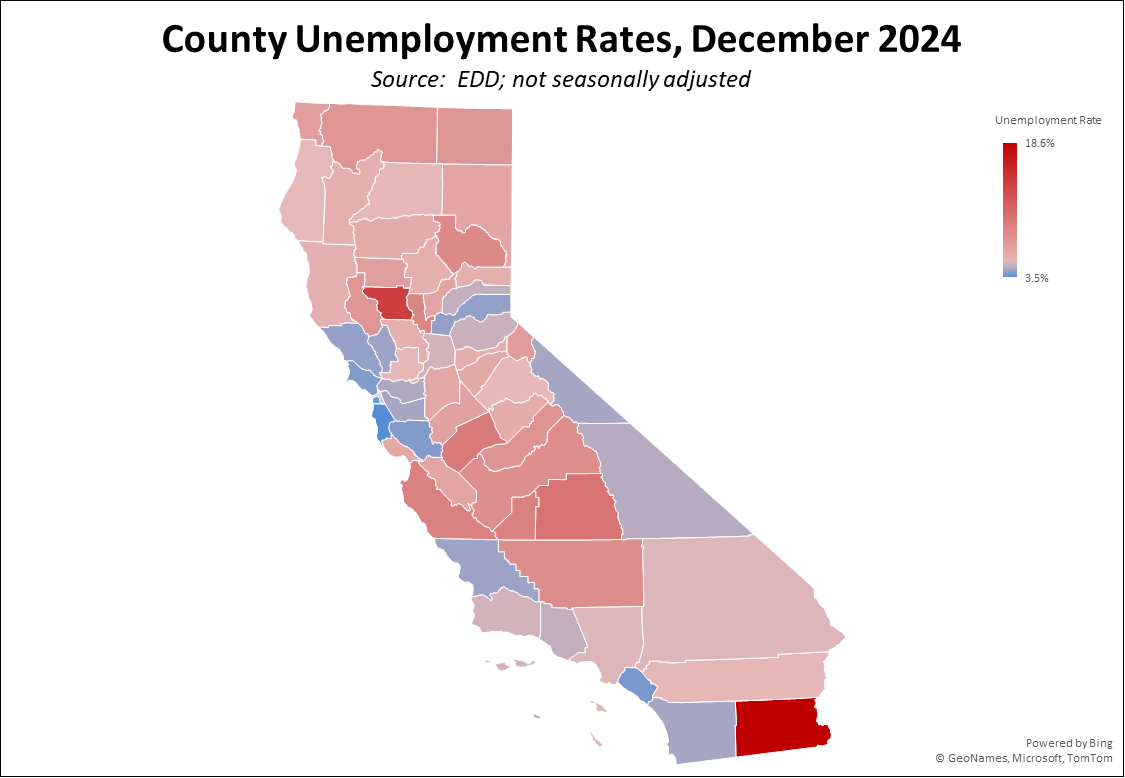
Counties with Double-Digit Unemployment