Highlights for policy makers:
- Effect of Data Revisions on California Employment
- COVID-19 and the State Economy
- Comparative Recovery: California at #2 for the Year
- CaliFormer Businesses
- Nonfarm Jobs: 96,700 Gain
- Employment Still 236,600 Below Pre-Covid Level
- Labor Force Participation Rate
- Unemployment Rates by Legislative District
- MSAs with the Worst Unemployment Rates
Effect of Data Revisions on California Employment
As indicated in our preliminary report last Friday, the January 2023 jobs and labor data incorporates the first tranche of the annual data revisions. EDD has not yet completed its release of the revised data. Consequently, the report below focuses more on the state revisions. County revisions will be provided in our report on the February 2023 data when it is released later this month.
As with much of the data during 2022, the data revisions show a mixed picture for the California economy and its recovery from the series of state-ordered shutdowns. The nonfarm wage and salary job numbers were revised upwards, with the 4th quarter 2022 numbers stronger than previously reported. The job numbers then generally followed the previously indicated trend but stalled out in 4th quarter 2023 rather than showing a shallow rise as in the prior data. Overall, nonfarm jobs at the end of 2022 were 107,800 higher than last year’s reports. Prior years saw only minor revisions.
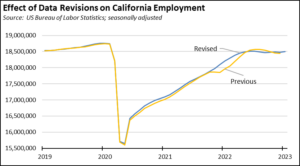
Revisions to the labor force data, however, indicate California’s employment remained largely unchanged, with only minor revisions to the seasonally adjusted employment numbers. As with the jobs numbers, employment was stronger than previously reported beginning in 4th quarter 2022 but weakened in the second half of the year. Overall, employment at the end of 2022 was only 41,600 higher than previously indicated.
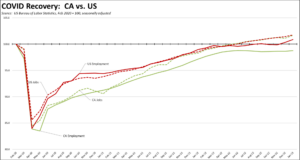
COVID-19 and the State Economy
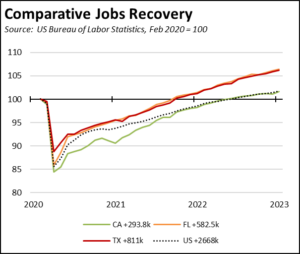
The nonfarm jobs revisions show California reached a recovery point—as defined by breaching the February 2020 per-pandemic peak—somewhat earlier than previously indicated in the data. The state reached this point at the same time as the US total in June 2022. In contrast to the national picture, however, California employment levels remain short of the pre-pandemic point. In the January 2023 data, California nonfarm jobs were 1.7% above the pre-pandemic peak (US at 1.8%), while employment was 1.3% below (US at 0.9% above).
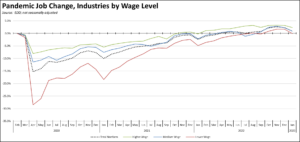
Broken out by wage level using the unadjusted data series, the lower wage industries saw a slight dip below recovery in January primarily due to seasonal factors. The higher wage industries lost some ground as the result of increasing layoffs in the tech industry.
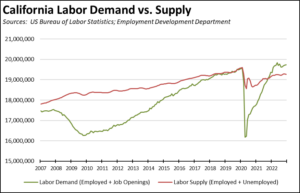
Continued jobs growth in the state also remains severely limited by labor shortages. Unfilled job openings at the end of December continued growing to 1.251 million in the revised data.
Combining unfilled job openings with the labor force data, total labor demand has exceeded the available supply since last November, causing the job numbers to remain well below their potential. The labor force participation rate remains nearly a full point below the February 2020 level.
Comparative Recovery: California at #2 for the Year
The January nonfarm job numbers for California were the strongest since February 2022, showing a gain of 96,700 compared to Texas at 48,600 and Florida at 30,000. Looking at the moving 12-month total, California instead falls to second place at 635,000 for the year compared to Texas at 678,000 but still ahead of smaller Florida at 478,000.
Even with the improved recovery date, the California numbers fall behind many other states in real jobs growth rather than recovering the jobs lost during the state shutdowns. To date, California is only 293,800 jobs above the pre-pandemic peak, compared to Texas at 811,000 and Florida at 582,500.
CaliFormer Businesses
Additional CaliFormer companies identified since our last monthly report are shown below. The listed companies include those that have announced: (1) moving their headquarters or full operations out of state, (2) moving business units out of state (generally back office operations where the employees do not have to be in a more costly California location to do their jobs), (3) California companies that expanded out of state rather than locate those facilities here, and (4) companies turning to permanent telework options, leaving it to their employees to decide where to work and live. The list is not exhaustive but is drawn from a monthly search of sources in key cities.
CaliFormers Update
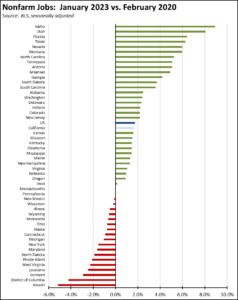
Nonfarm Jobs: 96,700 Gain
Nonfarm wage and salary jobs were up 96,700 (seasonally adjusted) in January, while the previously reported gains of 16,200 in December were revised to a loss of 20,200.
On a comparative basis with all the states, California ranks 20th in overall jobs recovery, just slightly below the national average performance.
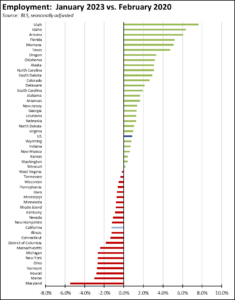
Employment Still 236,600 Below Pre-Covid Level
Employment (seasonally adjusted; January preliminary) showed the strongest monthly gain since June 2022 in the revised numbers. Employment was up 21,300. The number of unemployed rose 23,500.
The reported unemployment rate grew 0.1 point to 4.2%. California had the 9th highest unemployment rate among the states, and contained 14% of the total number of unemployed workers in the US.
In the national numbers, total US employment grew by a much stronger 894,000, and the number of unemployed edged down by 28,000. The reported unemployment rate improved 0.1 point to 3.4%.
![]()
On a comparative basis with the other states, California ranked 40th in employment recovery against the pre-pandemic peak. This outcome again indicates the extent to which most other states have been more focused on returning their workers to jobs and the extent to which other states, in particular the southeastern and midwestern states, have been successful in growing middle class wage jobs especially through the reshoring of chips manufacturing and the expansion of electric vehicle, battery, and green energy manufacturing producing the products required for California’s policies.
Labor Force Participation Rate
The California labor force participation rate rose 0.2 point to 62.1%, while the US number edged up 0.1 point to 62.4%. The California rate still remains below the pre-pandemic level of 63.0%, which in turn was down substantially from prior years. Accounting for workers leaving the workforce since February 2020, there were an estimated 1.0 million out of work in December.
Unemployment Rates by Legislative District
We will be pausing publication of these estimates until the necessary data is available for the new legislative district boundaries from the American Community Survey.
MSAs with the Worst Unemployment Rates
The number of California MSAs among the 25 regions with the worst unemployment rates in December dropped from 11 to 9, although Modesto and Stockton MSAs fell just outside this group. Los Angeles-Long Beach-Anaheim MSA rose to #296 in a tie with 10 other MSAs in other states. The best performing California urban region was again San Jose-Sunnyvale-Santa Clara MSA, rising to a tie with 10 other MSAs at #31, with an unemployment rate of 2.2% compared to the best performing region, Madison, WI MSA, at 1.6%.
MSA Worst Employment Rates
| MSA | December Unemp. Rate | Rank (out of 389) |
| El Centro MSA | 14.8% | 389 |
| Visalia-Porterville MSA | 8.2% | 386 |
| Merced MSA | 7.4% | 384 |
| Salinas MSA | 6.9% | 383 |
| Hanford-Corcoran MSA | 6.8% | 381 |
| Bakersfield MSA | 6.7% | 380 |
| Yuba City MSA | 6.3% | 377 |
| Fresno MSA | 6.2% | 375 |
| Madera MSA | 6.0% | 373 |