The Center for Jobs and the Economy has released our initial analysis of the January employment and labor force data. The EDD and BLS releases are again on different schedules. Data for the other states will be addressed in our Full Jobs Report after it is released by Bureau of Labor Statistics next week. For additional information and data about the California economy visit www.centerforjobs.org/ca. Note that the data begins to reflect the annual revision process, with the US labor force numbers revised beginning in January 2021. The job numbers will be revised beginning with the release of January 2026 estimates.
Annual Revision Process Boosts Reported Job Growth in 2025
The January data includes the release of the annual revisions for the state and Los Angeles MSA, with updates to both the labor force and jobs data for 1990-2025 reflecting more current data along with revisions to the estimation models. Revisions for the remaining subareas of the state will be included with the February data.
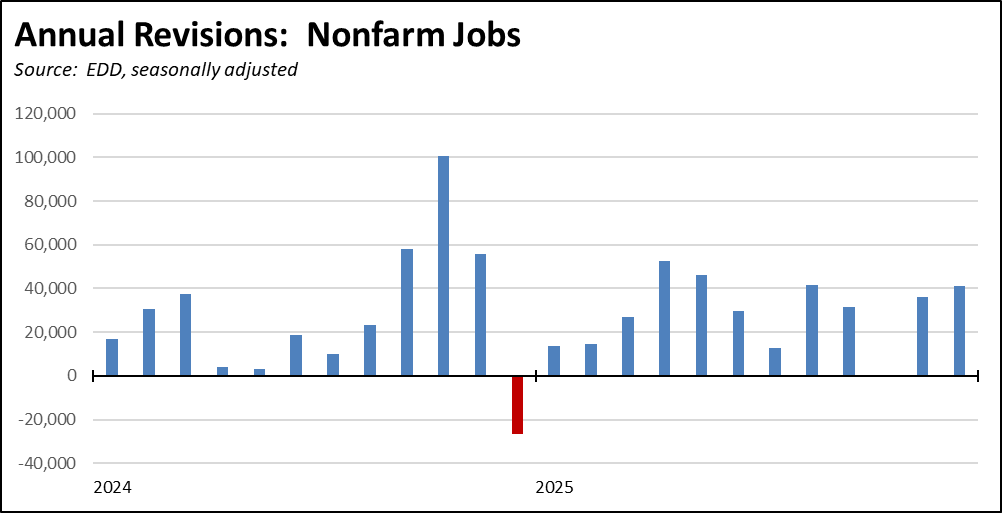
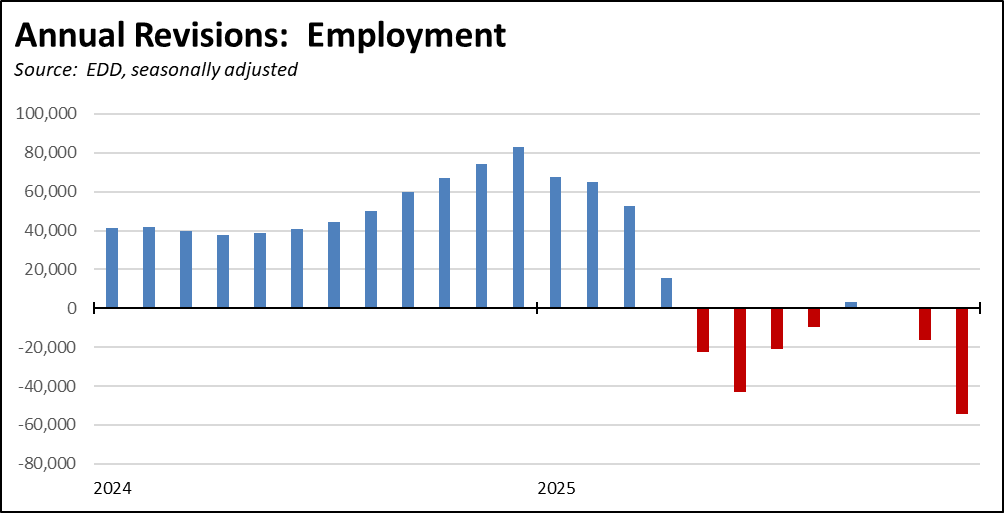
Unlike recent years, the revisions were generally positive for the state. Monthly revisions to nonfarm jobs (seasonally adjusted) were almost uniformly positive, with the March benchmark 16,700 higher. The relative adjustment, however, was small, with a monthly revision average of only 0.16% in the period shown. For the year, the preliminary loss of 11,200 jobs in 2025 was revised to a minor gain of 56,600, or only 4,700 a month.
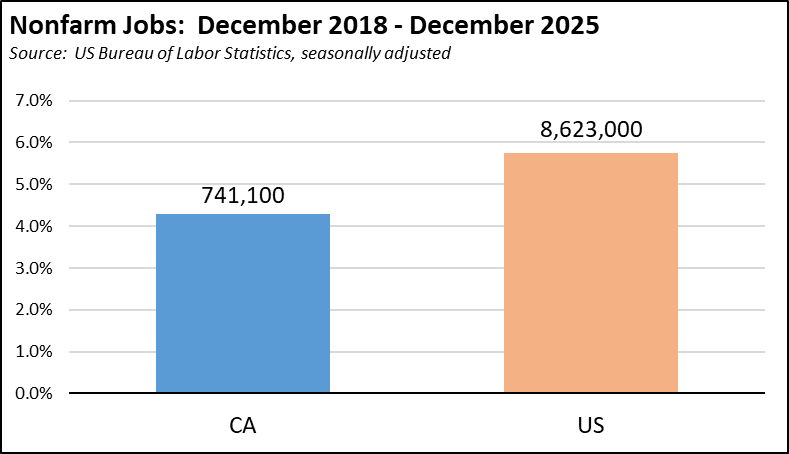
Updating the charts in our recent end-of-the-year report, the revised numbers show California’s performance in 2025 marginally improved with jobs growth of 0.3% compared to the US at 0.1%. Over the longer term since the end of 2018, California improved only slightly at jobs expansion of 4.3% compared to the US at 5.8%.
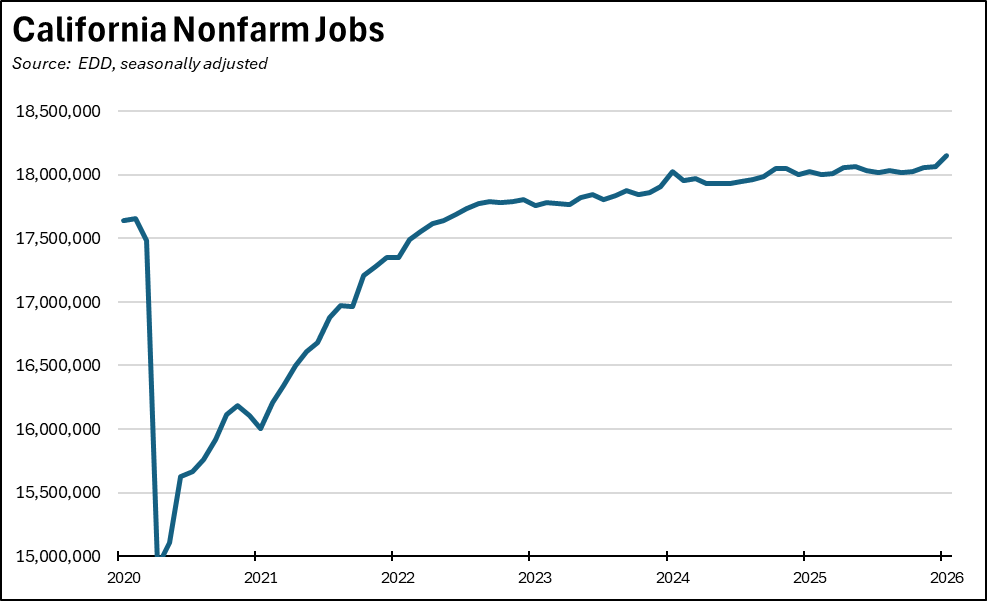
Because the revisions were minor—and putting aside the preliminary uptick in the January results—nonfarm jobs in the state still have shown little change over the past two years.
The employment revisions were more mixed. The monthly changes were marginal but negative in 2025 and generally positive in 2024. Overall, the monthly revisions averaged only 0.15% in the period shown. Because of the upward revisions in 2024, employment gains in 2025 were downgraded from 221,100 to 83,900, or 7,000 a month. Compared to pre-pandemic February 2020, employment is barely in recovery, showing a nominal gain of only 11,800.
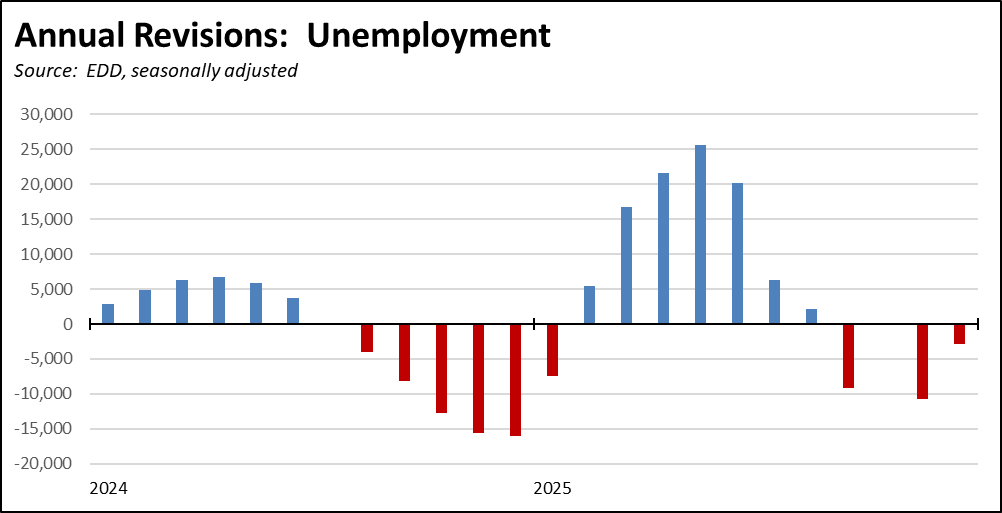
Revisions to the unemployment numbers showed a general increase in 2025, with an average monthly adjustment of 0.18% over the two years shown. Unemployment remained above the 1 million mark in every month beginning with January 2024.
The annual revisions also reflect shrinkage within parts of the California economy. EDD will no longer report on the following industries due to “low or declining employment or sample coverage.” Notably, the affected industries include motor vehicle manufacturing as the state’s previous policy of developing an electric vehicle manufacturing industry comes to a close with the repurposing of Tesla’s Fremont plant. Other basic manufacturing industries are included as well.
Nonfarm Jobs Up 93,500 in the Preliminary Estimate; 131,200 Gain for the Year
Nonfarm wage and salary jobs (seasonally adjusted) grew 93,500 in the preliminary estimate for January. December’s losses were revised to a nominal gain of 3,500. For the year, the preliminary January numbers combined with the revisions showed a gain of 131,200.
By industry, the preliminary January numbers still show government and government-supported Healthcare & Social Services dominating the numbers. However, the January uptick also finally shows growth in the other private industries, primarily Accommodation & Food Services, Other Services, and Professional, Scientific & Technical Services. These preliminary results, however, will be affected by the upcoming monthly revisions. The January numbers moreover still show the Other Private Industries 309,500 off their peak in September 2022.
California Labor Force
California Labor Force
California’s reported unemployment rate (seasonally adjusted) improved by 0.1 point from December to 5.4%. The US rate also improved by 0.1 point to 4.3%.
Employment was down marginally by 5,100 (seasonally adjusted) in January, while US employment fell by 895,000.
California unemployment edged down by 10,900, while US unemployment dropped by 135,000. California unemployment has been above 1 million every month since January 2024, the highest levels since the pandemic period in 2021.
Nonfarm Jobs
Nonfarm wage and salary jobs (seasonally adjusted) in the preliminary estimate rose 93,500, resulting in a total gain of 131,100 jobs for the year.
For the US as a whole, nonfarm jobs rose 160,000 in January and 324,000 over the year. The most recent data shows a preliminary gain of 178,000 in March after a 133,000 loss in February, largely reflecting the effects of healthcare strikes in February.
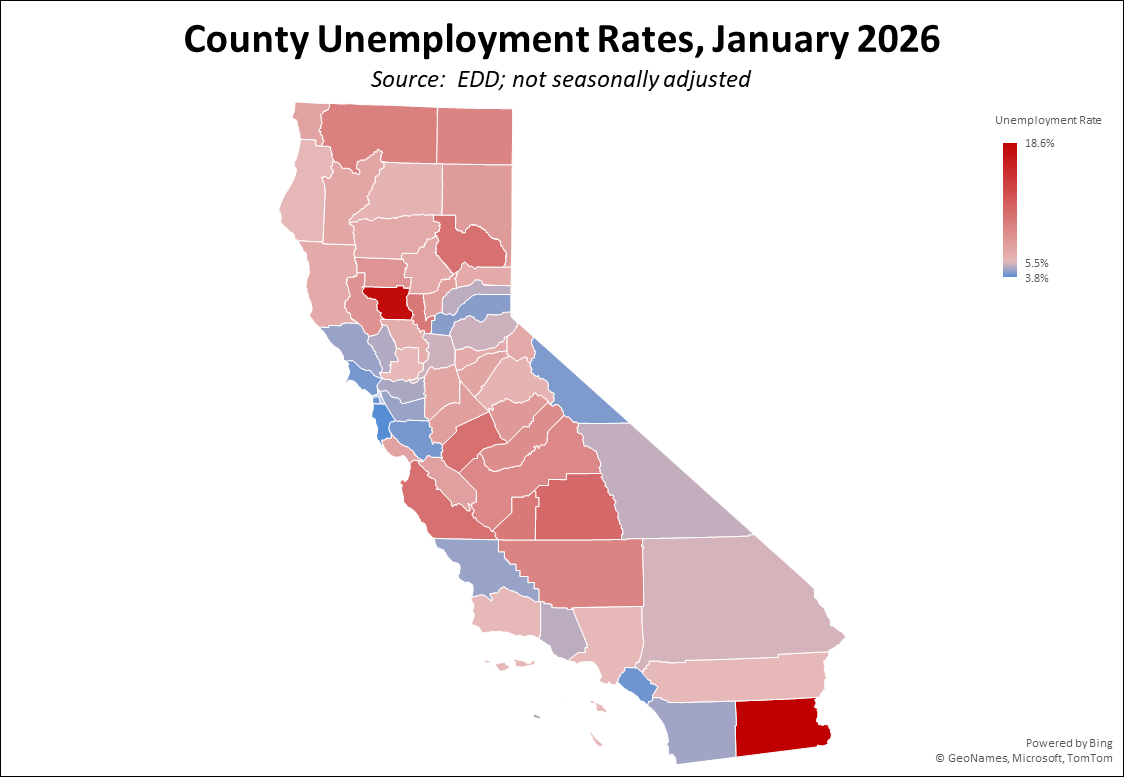
Counties with Double-Digit Unemployment
The number of counties with an unemployment rate (not seasonally adjusted) at 10% increased to 8. The unadjusted rates ranged from 3.8% in San Mateo to 18.6% in Imperial.
In the chart, counties with rates higher than the state average are coded in red.