The Center for Jobs and the Economy has released our initial analysis of the June Employment Report from the California Employment Development Department. For additional information and data about the California economy visit www.centerforjobs.org/ca.
Highlights for policy makers:
- Revenue Tracker
- Nonfarm Jobs Drop for the 4th Month in 2025
- California Unemployment Rate Up at 5.4%
- Employment Recovery Progress: California Finally Breaks Pre-Pandemic Peak
- Nonfarm Jobs
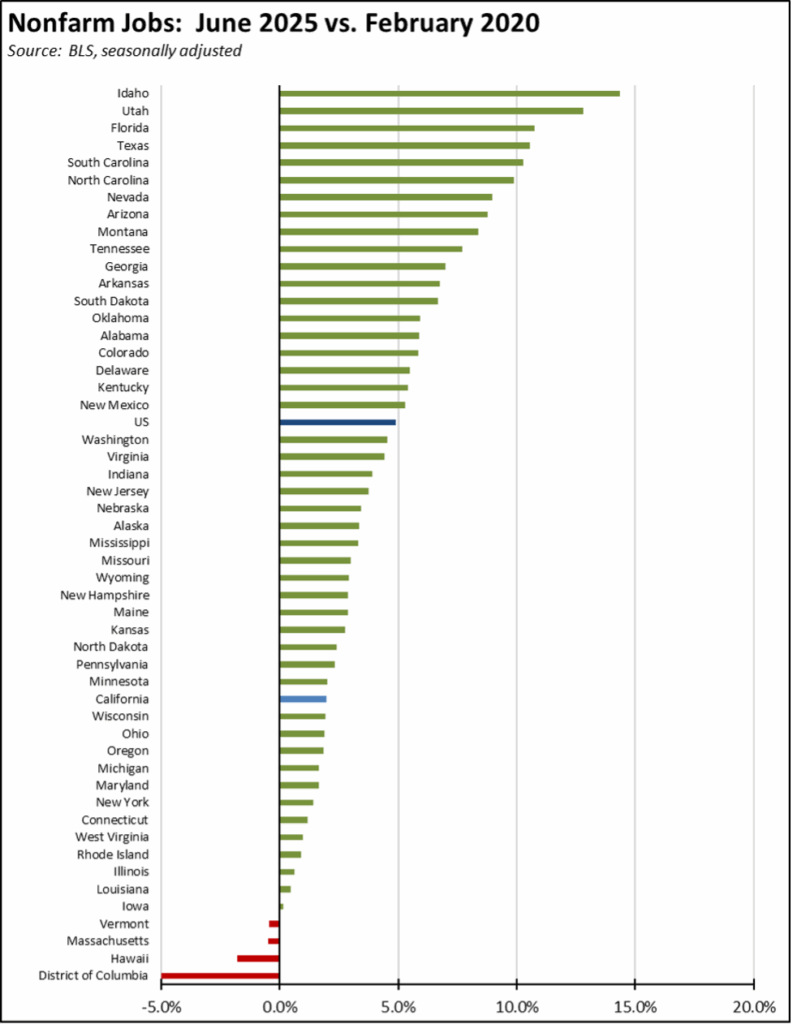
- Recovery Progress: CA Nonfarm Jobs vs. Other States
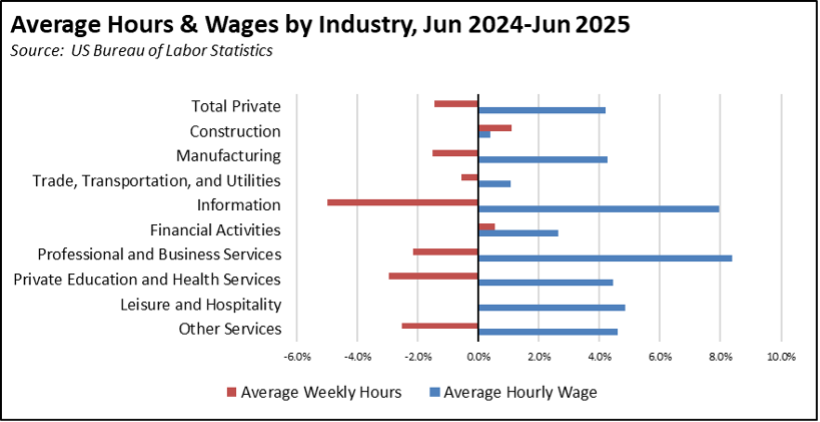
- Wages & Hours
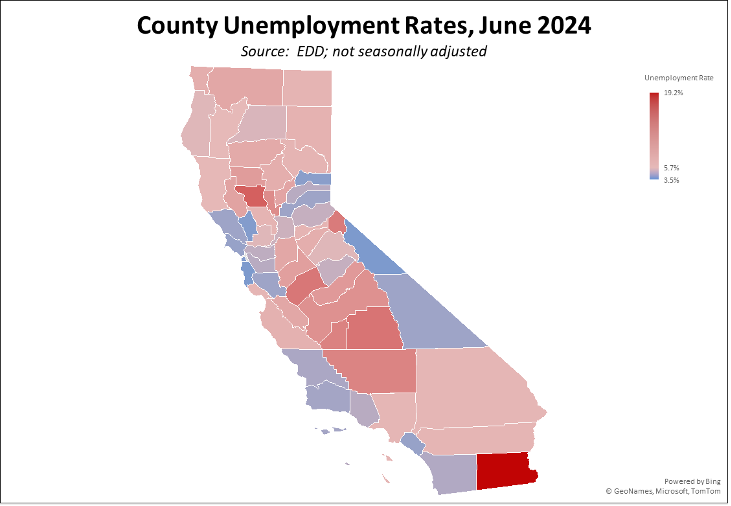
- Unemployment Rates by Region
- Counties with Double-Digit Unemployment
- Unemployment Rate by Legislative District
Revenue Tracker
The Department of Finance economic projections form the base of the revenue projections used to craft the state budget. Using the preliminary results from the June numbers, the most recent projections for the May Revise appear to be largely on target. As discussed in last month’s jobs report, however, the preliminary estimates coming from the full job counts in the Quarterly Census of Employment & Wages indicate that the state’s job numbers will be revised 102,700 lower when the annual revisions are made next March. This outcome would put the job projections off by -0.5%.
Nonfarm Jobs Drop for the 4th Month in 2025
In the preliminary numbers, seasonally adjusted nonfarm jobs fell 6,100 in June, the 4th month to date in 2025 posting a loss. The May numbers were adjusted down by 6,000 to a revised gain of 11,700, with California showing a net loss of 23,700 nonfarm jobs in the first half of the year.
The June result was the 45th highest among the states, with jobs again led by Ohio with a gain of 10,400 followed by Illinois with 9,400 and Georgia at 9,100.
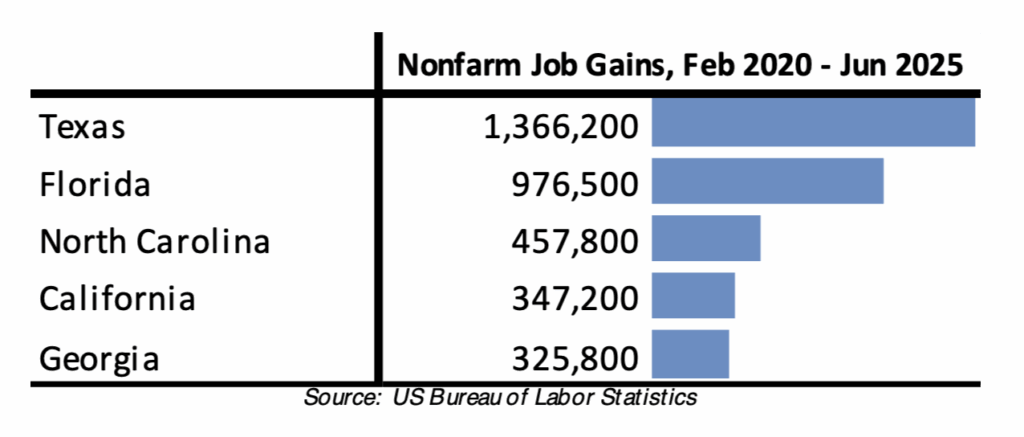
Looking at net total nonfarm job gains compared to pre-pandemic peaks, California remained in 4th place behind much smaller North Carolina but with Georgia continuing to gain ground.
By industry, both government and government-dependent Healthcare & Social Assistance again dominated the picture, with gains of 11,200 in June that were more than offset by a 17,300 loss in all other private industries. Still some gains were reported within this last category, led by seasonal upswings in Arts, Entertainment & Recreation (7,700), Construction (3,100), and Private Educational Services (1,800). These gains were more than offset by greater losses led by further drops in Manufacturing (-6,400) and Accommodation & Food Services (-3,400), as well as tech-containing Information (-6,100) and Professional, Scientific & Technical Services (-3,200).
California Unemployment Rate Up at 5.4%
California’s seasonally adjusted unemployment rate notched up 0.1 point to 5.4%, tied as the 2nd highest among the states with Nevada and below only DC. The US unemployment rate notched down 0.1 point to 4.1%. Total unemployed rose by 11,700, remaining above the 1 million level for the 18th month in a row.
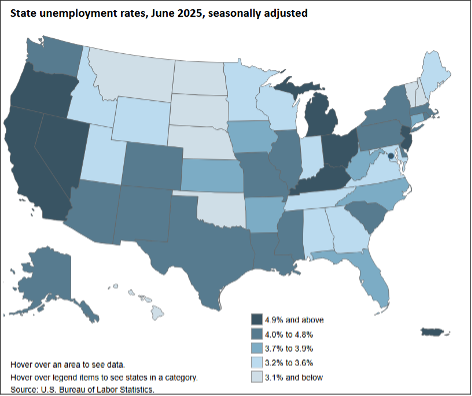
Interactive Original: https://www.bls.gov/charts/state-employment-and-unemployment/state-unemployment-rates-map.htm
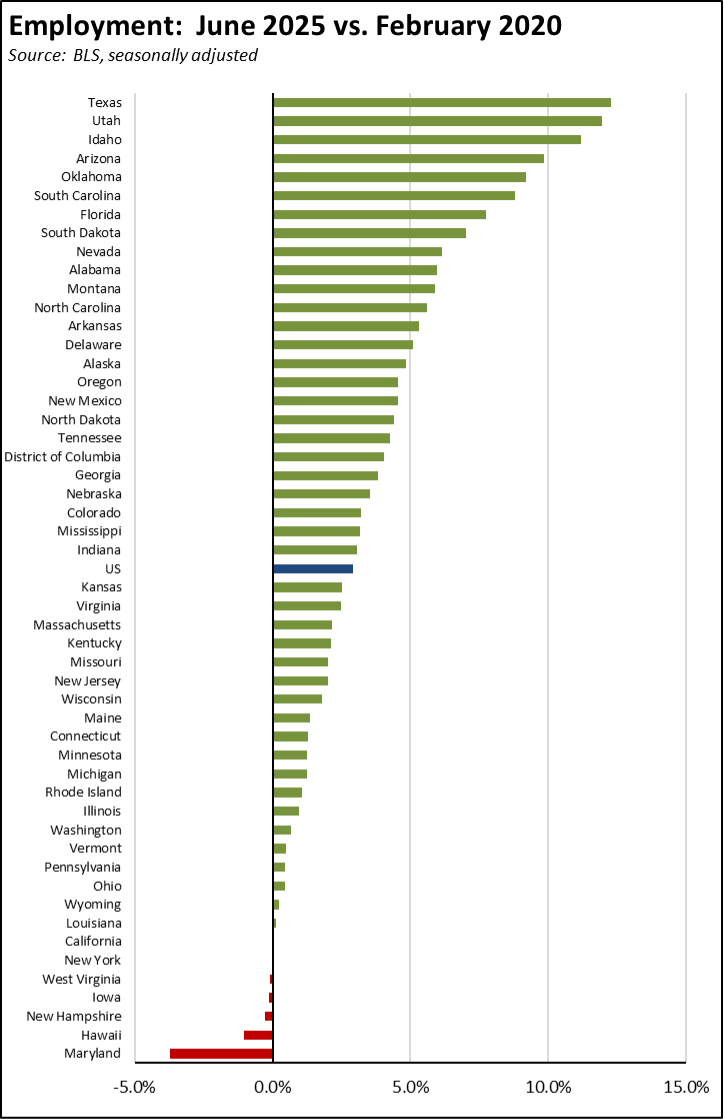
Employment Recovery Progress: California Finally Breaks Pre-Pandemic Peak
Compared to the pre-pandemic peak in February 2020, California’s relative ranking for employment recovery rose slightly to the 7th lowest among the states and DC. June, however, was the first time California employment was above the pre-pandemic levels, taking 64 months to fully recover from the state’s job closures and other restrictions during that period.
Nonfarm Jobs
Recovery Progress: CA Nonfarm Jobs vs. Other States
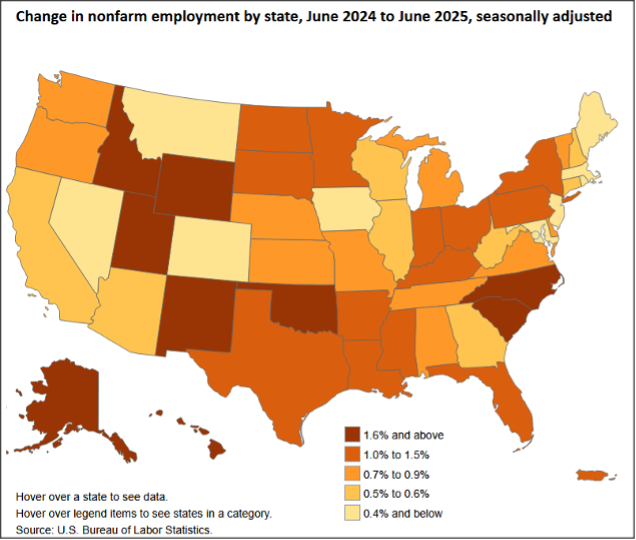
Interactive Original: https://www.bls.gov/charts/state-employment-and-unemployment/change-in-nonfarm-employment-by-state-map.htm
California’s monthly job performance in June was the 45th highest among the states and DC. Adjusted for size, California’s recovery level compared to the pre-pandemic peaks remained the 35th highest, while only 3 states and DC have yet to show positive recovery.
Wages & Hours
Unemployment Rates by Region
Unemployment rates (not seasonally adjusted) were higher in all regions other than the Central Coast compared to pre-pandemic February 2020 levels.
Counties with Double-Digit Unemployment
Unemployment Rate by Legislative District
The estimated unemployment rates are shown below for the highest and lowest districts. The full data and methodology are available on the Center’s website.