Highlights for policy makers:
- Unemployment Unchanged at 3.9%; Employment Up 56,300
- Labor Force Participation Rate Up to 62.4%
- Employment Growth Ranking
- Nonfarm Jobs Up 12,600 for Month; California Remains at #2 for 12-month Gain
- Jobs Change by Industry
- Structural Shifts in State’s Economy
- Unemployment Rates by Region (not seasonally adjusted)
- Unemployment Rates by Legislative District
- Employment Growth by Region
- MSAs with the Worst Unemployment Rates
- Chart of the Month: End of Year Review
Unemployment Unchanged at 3.9%; Employment Up 56,300
EDD reported total employment (seasonally adjusted; December preliminary) was up 56,300 from the revised November numbers, while the number of unemployed dipped 4,000. Unemployment rate remained at the series low of 3.9%. The unadjusted rate was down 0.4 point from the year earlier to 3.7%.
California dipped to the 13th highest unemployment rate among the states.
Total US employment saw a seasonally adjusted gain of 267,000, with the number of unemployed down by 58,000. The unemployment rate remained level at 3.5%, matching the previous two months’ as the lowest since 1969.
Figure Sources: California Employment Development Department; US Bureau of Labor Statistics
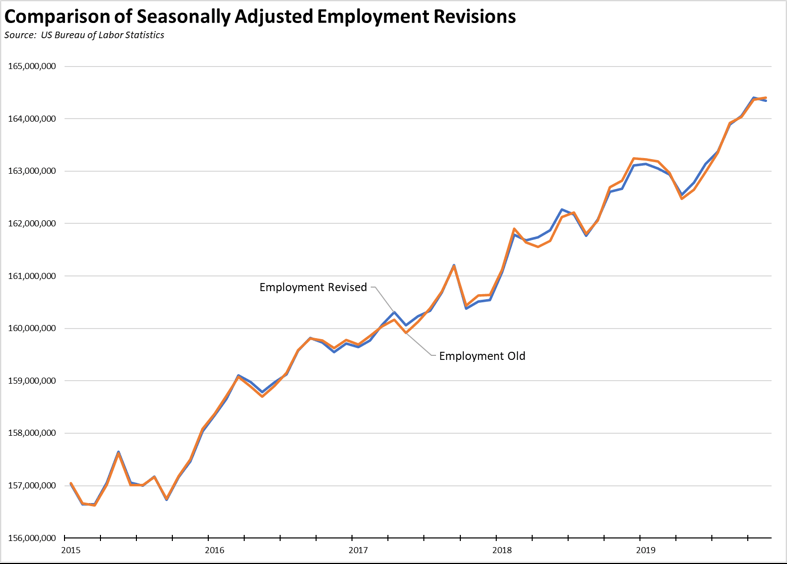
The US numbers come from the first stage in the annual revisions to the labor force and wage and salary job estimates, with the January revisions applied to the national labor force numbers from 2015 through 2019. This process will continue through the data released in March revising the numbers for states and counties, which then will also be used along with the updated American Community Survey factors to revise our estimates for the legislative districts. The data will be updated in our web site as it becomes available, but this difference should be considered in comparing geographic areas until the revisions are completed.
As indicated below, the revisions are relatively minor compared to those of prior years. On a year-to-year comparison, both the revised labor force and employment numbers are about 6% higher for the 12 months ending November.
Labor Force Participation Rate Up to 62.4%
California’s seasonally adjusted labor force participation rate edged up to 62.4%. Nationally, the participation rate was constant at 63.2%. The state continues to experience lower than average participation rates in spite of having a relatively younger population than the rest of the US.
For the 12 months ending December 2019, the seasonally adjusted data shows the California labor force with minor improvement, at a gain of 36,900 workers (0.2% growth) compared to the rest of the US gain of 1.4 million (+1.0%). While the December numbers finally show some improvement, they are just as much the result of the seasonal adjustment factors and are subject to change in the upcoming March revisions. The underlying unadjusted numbers, however, show a 0.3% improvement over the year, positive but still a third of the overall US expansion rate of 0.9%.
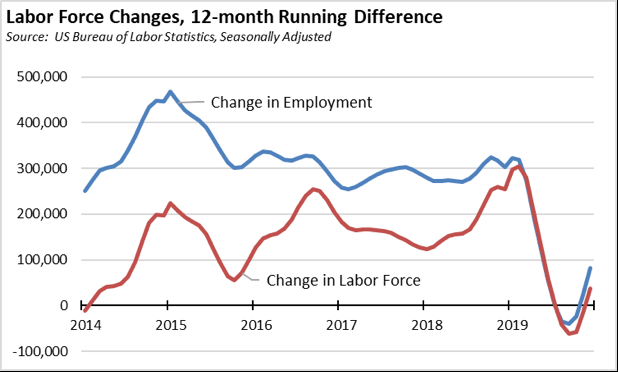
The overall results for 2019, as in the figure above, show the labor force numbers for the year as a whole took a steep dive. This stall out in labor force growth has significant implications for the California economy. The increasing difficulty of finding qualified workers, and in some cases any workers, puts California businesses at a competitive disadvantage to other states where the current expansion continues to draw workers back into the labor force. At the same time, this situation produces caseload demands on state and local welfare and other social assistance budgets well above where they should be given the current stage of the extended recovery.
With the state’s labor force numbers still significantly below the national level, there should be the conditions for further economic expansion. However, the high cost conditions in the regions leading the jobs expansion—in particular housing but also including energy and the cost of goods and services that have risen in response to those energy costs—continue to impose a substantial barrier to labor mobility that would make this outcome possible.
Employment Growth Ranking
The total number of persons employed (seasonally adjusted) over the 12 months ending in December grew by only 81,800. As a result, California rose to 12th highest among the states in terms of absolute employment growth over the month, with Texas leading with an additional 293,400 persons employed over this period, and Florida in second place with a gain of 253,100.
Adjusted to account for differences in the size of each state economy, California over the year grew by 0.4%, below the average for the rest of the US with a gain of 1.4%. Ranked among the states, California’s growth rate was little changed at 41st place, while Alabama led with 4.0% growth.
Figure Source: US Bureau of Labor Statistics
Nonfarm Jobs Up 12,600 for Month; California Remains at #2 for 12-month Gain
Nonfarm jobs (seasonally adjusted) were up 12,600 as November’s seasonally adjusted gains were revised to 24,000 from the previously reported 32,000.
For the 12 months ending December, total jobs growth was 310,100, keeping the state’s rank in 2nd place behind Texas which gained 342,800 jobs in this period, with Florida in third at 212,000.
Adjusting for population size, California notched up to 13th among the states, with a 12-month jobs growth rate of 1.8% compared to the rest of the US at 1.4%.
Figure Sources: California Employment Development Department; US Bureau of Labor Statistics
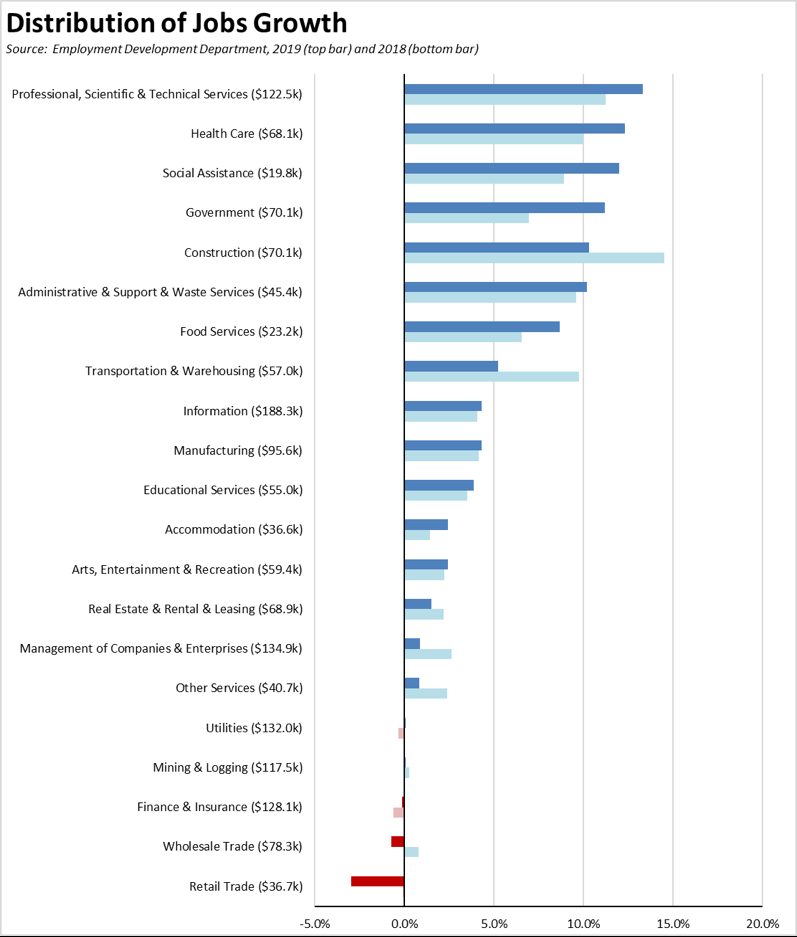
Jobs Change by Industry
In the unadjusted numbers that allow a more detailed look at industry shifts, hiring saw increases in all but 2 industries over the year.
Gains in payroll jobs were led by Government ($70.1k average annual wages), Social Assistance ($19.8k), and Health Care ($68.1k average annual wages).
Declines were again seen in Wholesale Trade ($78.3k) and Retail Trade ($36.7k).
All wage data is from the most current 4-quarter average from the Quarterly Census of Employment & Wages.
| Not Seasonally Adjusted Payroll Jobs (1,000) | Dec 2019 | 12-month change | Nonfarm Growth Rank |
|---|---|---|---|
| Total Farm | 373.2 | 7.9 | |
| Mining & Logging | 23.3 | 0.2 | 18 |
| Construction | 889.8 | 30.4 | 5 |
| Manufacturing | 1,339.3 | 11.7 | 11 |
| Wholesale Trade | 698.0 | -2.8 | 20 |
| Retail Trade | 1,760.0 | -6.5 | 21 |
| Utilities | 57.4 | 0.2 | 18 |
| Transportation & Warehousing | 653.5 | 11.9 | 10 |
| Information | 566.2 | 12.4 | 9 |
| Finance & Insurance | 550.1 | 6.5 | 13 |
| Real Estate & Rental & Leasing | 300.2 | 6.7 | 12 |
| Professional, Scientific & Technical Services | 1,331.3 | 30.4 | 5 |
| Management of Companies & Enterprises | 260.9 | 4.3 | 16 |
| Administrative & Support & Waste Services | 1,189.1 | 37.5 | 4 |
| Educational Services | 407.0 | 18.5 | 7 |
| Health Care | 1,601.1 | 39.3 | 3 |
| Social Assistance | 864.3 | 40.5 | 2 |
| Arts, Entertainment & Recreation | 321.4 | 5.6 | 15 |
| Accommodation | 239.2 | 5.9 | 14 |
| Food Services | 1,465.6 | 14.5 | 8 |
| Other Services | 573.9 | 3.2 | 17 |
| Government | 2,669.5 | 40.9 | 1 |
| Total Nonfarm | 17,761.1 | 311.3 | |
| Total Wage & Salary | 18,134.3 | 319.2 | |
Figure Source: California Employment Development Department
Structural Shifts in State’s Economy
Comparing current job numbers to the pre-recession levels in 2007 illustrates the structural shift in the state’s economy, with the primary jobs growth occurring in the higher and lower wage industries. Losses in Retail Trade continue to mount in large part due to continuing pressures on brick-and-mortar stores from E-tailing, particularly at a time these traditional employers face increasing cost pressures from the state’s minimum wage and energy policies. Manufacturing, while not recovering at the same rate as the national numbers (see February 2019 Jobs Report) continues to show positive recovery trends.
Construction as a middle class wage, blue collar industry continues to be within the positive column, but at levels still within the 2007 monthly numbers. Jobs, however, remain 76,500 (7.9%) below the all-time peak reached the year before in 2006. Residential Building Construction accounts for about a third of the remaining gap, with the December 2019 job levels 28,800 below the all-time peak in 2006.
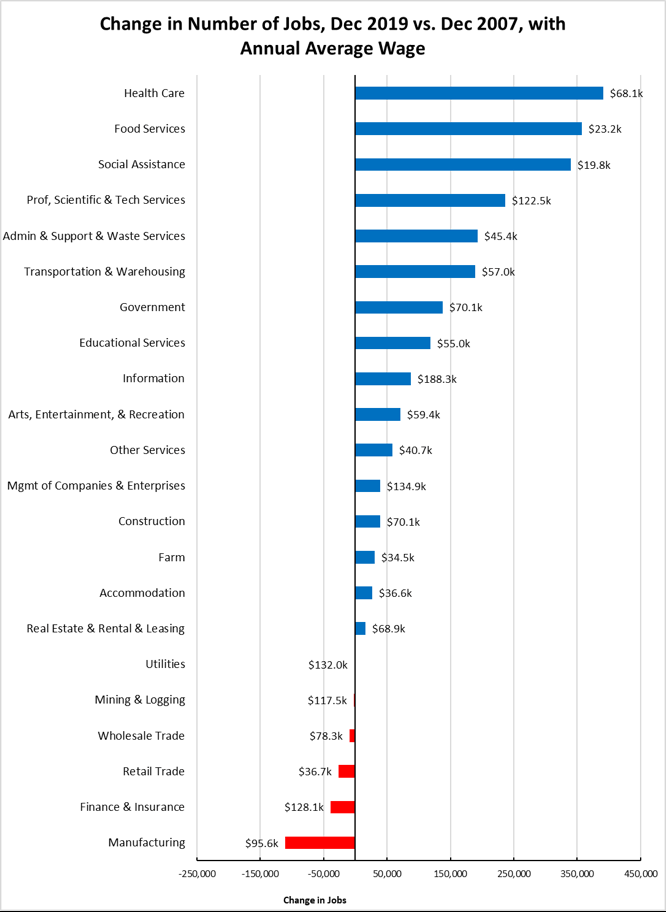
Figure Source: California Employment Development Department
Unemployment Rates by Region (not seasonally adjusted)
| wdt_ID | Region | Unemployment Rates |
|---|---|---|
| 1 | California | 3.7 |
| 2 | Bay Area | 2.3 |
| 3 | Orange County | 2.4 |
| 4 | Sacramento | 3.2 |
| 6 | San Diego/Imperial | 3.5 |
| 7 | Inland Empire | 3.5 |
| 8 | Central Sierra | 3.6 |
| 9 | Los Angeles | 3.9 |
| 10 | Upstate California | 4.9 |
| 11 | Central Coast | 5.2 |
| 12 | Central Valley | 7.0 |
Figure Source: California Employment Development Department
Unemployment Rates by Legislative District
Lowest
| wdt_ID | Congressional District | Unemployment Rate |
|---|---|---|
| 1 | CD12 (Pelosi-D) | 1.8 |
| 2 | CD18 (Eshoo-D) | 1.9 |
| 3 | CD14 (Speier-D) | 1.9 |
| 4 | CD17 (Khanna-D) | 2.0 |
| 5 | CD15 (Swalwell-D) | 2.1 |
| 6 | CD52 (Peters-D) | 2.2 |
| 7 | CD49 (Levin-D) | 2.2 |
| 8 | CD45 (Porter-D) | 2.2 |
| 9 | CD48 (Rouda-D) | 2.2 |
| 10 | CD02 (Huffman-D) | 2.5 |
| wdt_ID | Senate District | Unemployment Rate |
|---|---|---|
| 1 | SD13 (Hill-D) | 1.7 |
| 2 | SD11 (Wiener-D) | 2.0 |
| 3 | SD36 (Bates-R) | 2.2 |
| 4 | SD37 (Moorlach-R) | 2.2 |
| 5 | SD39 (Atkins-D) | 2.2 |
| 6 | SD10 (Wieckowski-D) | 2.2 |
| 7 | SD07 (Glazer-D) | 2.4 |
| 8 | SD15 (Beall-D) | 2.4 |
| 9 | SD02 (McGuire-D) | 2.7 |
| 10 | SD38 (Jones-R) | 2.7 |
| wdt_ID | Assembly District | Unemployment Rate |
|---|---|---|
| 1 | AD22 (Mullin-D) | 1.6 |
| 2 | AD16 (Bauer-Kahan-D) | 1.7 |
| 3 | AD24 (Berman-D) | 1.8 |
| 4 | AD17 (Chiu-D) | 1.9 |
| 5 | AD28 (Low-D) | 1.9 |
| 6 | AD19 (Ting-D) | 2.0 |
| 7 | AD25 (Chu-D) | 2.0 |
| 8 | AD78 (Gloria-D) | 2.1 |
| 9 | AD73 (Brough-R) | 2.1 |
| 10 | AD10 (Levine-D) | 2.2 |
Highest
| wdt_ID | Congressional District | Unemployment Rate |
|---|---|---|
| 3 | CD09 (McNerney-D) | 5.1 |
| 5 | CD22 (Nunes-R) | 6.8 |
| 7 | CD51 (Vargas-D) | 8.0 |
| 8 | CD20 (Panetta-D) | 6.2 |
| 9 | CD16 (Costa-D) | 8.1 |
| 10 | CD44 (Barragan-D) | 5.5 |
| 12 | CD21 (Cox-D) | 8.6 |
| 13 | CD23 (McCarthy-R) | 6.5 |
| 15 | CD10 (Harder-D) | 5.3 |
| 16 | CD40 (Roybal-Allard-D) | 4.6 |
| wdt_ID | Senate District | Unemployment Rate |
|---|---|---|
| 1 | SD14 (Hurtado-D) | 9.7 |
| 2 | SD12 (Caballero-D) | 7.2 |
| 3 | SD08 (Borgeas-R) | 5.4 |
| 4 | SD30 (Mitchell-D) | 4.7 |
| 5 | SD05 (Galgiani-D) | 5.4 |
| 6 | SD16 (Grove-R) | 6.2 |
| 7 | SD33 (Gonzalez-D) | 4.5 |
| 8 | SD40 (Hueso-D) | 6.7 |
| 9 | SD24 (Durazo-D) | 4.5 |
| 11 | SD35 (Bradford-D) | 4.9 |
| wdt_ID | Assembly District | Unemployment Rate |
|---|---|---|
| 1 | AD13 (Eggman-D) | 6.2 |
| 2 | AD23 (Patterson-R) | 5.8 |
| 4 | AD21 (Gray-D) | 7.4 |
| 6 | AD34 (Fong-R) | 5.9 |
| 7 | AD32 (Salas-D) | 8.8 |
| 8 | AD31 (Arambula-D) | 8.4 |
| 9 | AD26 (Mathis-R) | 9.0 |
| 10 | AD56 (Garcia-D) | 9.5 |
| 11 | AD64 (Gipson-D) | 5.5 |
| 12 | AD59 (Jones-Sawyer-D) | 5.4 |
Employment Growth by Region
Containing 19.5% of the state’s population, the Bay Area has accounted for 37.2% of net employment growth compared to pre-recession levels. Los Angeles Region, with 29.0% of the population, accounted for only 18.9% of net employment gains, but moved ahead of Inland Empire with now the third highest.
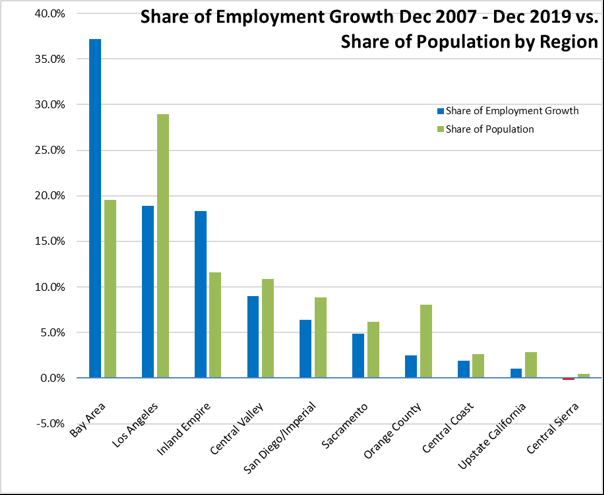
Figure Sources: California Employment Development Department; Department of Finance
MSAs with the Worst Unemployment Rates
Of the 20 Metropolitan Statistical Areas (MSAs) with the worst unemployment rates in November 2019, 8 are in California, including El Centro MSA (Imperial County) which continues with Great Depression-era levels of unemployment that are 11 times worse than in San Mateo, the county with the lowest unemployment rate.
| wdt_ID | MSA | Unemp. | Rank (out of 389) |
|---|---|---|---|
| 1 | El Centro MSA | 20.6 | 389 |
| 2 | Visalia-Porterville MSA | 8.5 | 387 |
| 3 | Hanford-Corcoran MSA | 7.1 | 384 |
| 4 | Merced MSA | 6.5 | 382 |
| 5 | Fresno MSA | 6.5 | 382 |
| 6 | Bakersfield MSA | 6.4 | 381 |
| 7 | Madera MSA | 6.1 | 379 |
| 8 | Yuba City MSA | 5.7 | 377 |
Figure Source: US Bureau of Labor Statistics, November 2018 data
Chart of the Month: End of Year Review
While the December numbers are still subject to revisions—both from the normal monthly revision process and the annual revision that will be available in March—the “close out” of the year has naturally led to an overall look at the state’s performance.
Nonfarm Jobs. At 1.8%, California’s change in Nonfarm wage and salary jobs outperformed the average for all other states (1.4%). This outcome is better than the 2018 results considered both from the actual rate and comparison with the rest of the US.
Reflecting the growing out-migration as covered in various recent media reports, states around California did better. The adjacent states grew somewhat faster—the 1.9% for Nevada and Oregon—to much faster as is the case with Arizona’s 2.8%. States in the “next ring” of the second state away from our borders did substantially better as well except New Mexico which matched California’s rate.
The other two states with over 20 million population outperformed California in both years when measured by the jobs growth rate, roughly half again as much better. Texas, which currently is only 2/3 the size of California, outperformed California as well when measured by total number of net new jobs.
| 2019 Job Change | Percentage Change | 2018 Job Change | Percentage Change | |
|---|---|---|---|---|
| California | 310,300 | 1.8% | 278,400 | 1.6% |
| US other than CA | 1,797,700 | 1.4% | 2,400,600 | 1.8% |
| Border States | ||||
| Arizona | 80,800 | 2.8% | 81,100 | 2.9% |
| Nevada | 27,400 | 1.9% | 51,000 | 3.7% |
| Oregon | 36,800 | 1.9% | 26,700 | 1.4% |
| Next Ring States | ||||
| Colorado | 56,600 | 2.1% | 55,200 | 2.1% |
| Idaho | 21,600 | 2.9% | 17,500 | 2.4% |
| New Mexico | 15,600 | 1.8% | 10,300 | 1.2% |
| Utah | 47,900 | 3.1% | 48,900 | 3.3% |
| Washington | 84,200 | 2.4% | 86,200 | 2.6% |
| Over 20 Million States | ||||
| Texas | 342,800 | 2.7% | 288,900 | 2.3% |
| Florida | 212,000 | 2.4% | 225,800 | 2.6% |
Types of Jobs. Distribution of jobs by industry (not seasonally adjusted) is shown in the chart below. Because the annual average for 2019 has not yet been published, the job changes are calculated using the 2019 average using the preliminary December data.
As indicated, government jobs and very low wage social assistance jobs (most of which are supported by government spending) accounted for just under a quarter of California’s job performance. Elsewhere in the US, these two industries provided just under 10% of nonfarm jobs growth.
High tech represented by professional, scientific & technical services led overall, but construction was the only blue collar middle-class wage industry to make it into the top 5 in 2019 compared to two industries at this wage level in 2018.