The Center for Jobs and the Economy has released our initial analysis of the March employment and labor force data. The EDD and BLS releases are again on different schedules. Data for the other states will be addressed in our Full Jobs Report after it is released by Bureau of Labor Statistics next week.
For additional information and data about the California economy visit www.centerforjobs.org/ca.
Nonfarm Jobs Rise 28,700 as Striking Healthcare Workers Go Back to Work
Nonfarm wage and salary jobs (seasonally adjusted) rose 28,700 in the preliminary estimate for March primarily as healthcare workers ended their strikes. February’s losses were revised up by 1,100 to a loss of 18,800. For the year, the preliminary March seasonally adjusted numbers showed a gain of 144,700.
Adjusting for the effects of the February strikes by combining the February and March results, the average gain for the two months was only 5,000 nonfarm jobs.
By industry, the preliminary March numbers still show government and government-supported Healthcare & Social Services dominating the numbers. However, growth still was seen in some of the Other Private Industries, including Construction, Retail Trade, Real Estate & Rental & Leasing, and Arts, Entertainment & Recreation.
California Labor Force
California Labor Force
California’s reported unemployment rate (seasonally adjusted) dipped to 5.3% due to a sizeable drop in the labor force. The US rate also dipped by by 0.1 point to 4.3% but based on a relatively stable labor force number.
Employment again fell, by 36,600 (seasonally adjusted) in March, while US employment was essentially unchanged with a dip of 64,000.
California unemployment was largely unchanged with a dip of 17,100, while US unemployment fell by 332,000. California unemployment has been above 1 million every month since January 2024, the highest levels since the pandemic period in 2021.
Nonfarm Jobs
Nonfarm wage and salary jobs (seasonally adjusted) in the preliminary estimate rose by 28,700, resulting in a total gain of 144,700 jobs for the year.
For the US as a whole, nonfarm rose 178,000 in March and showed a gain of 260,000 over the year. Again adjusting the strikes, the average job gain in February and March was 22,500.
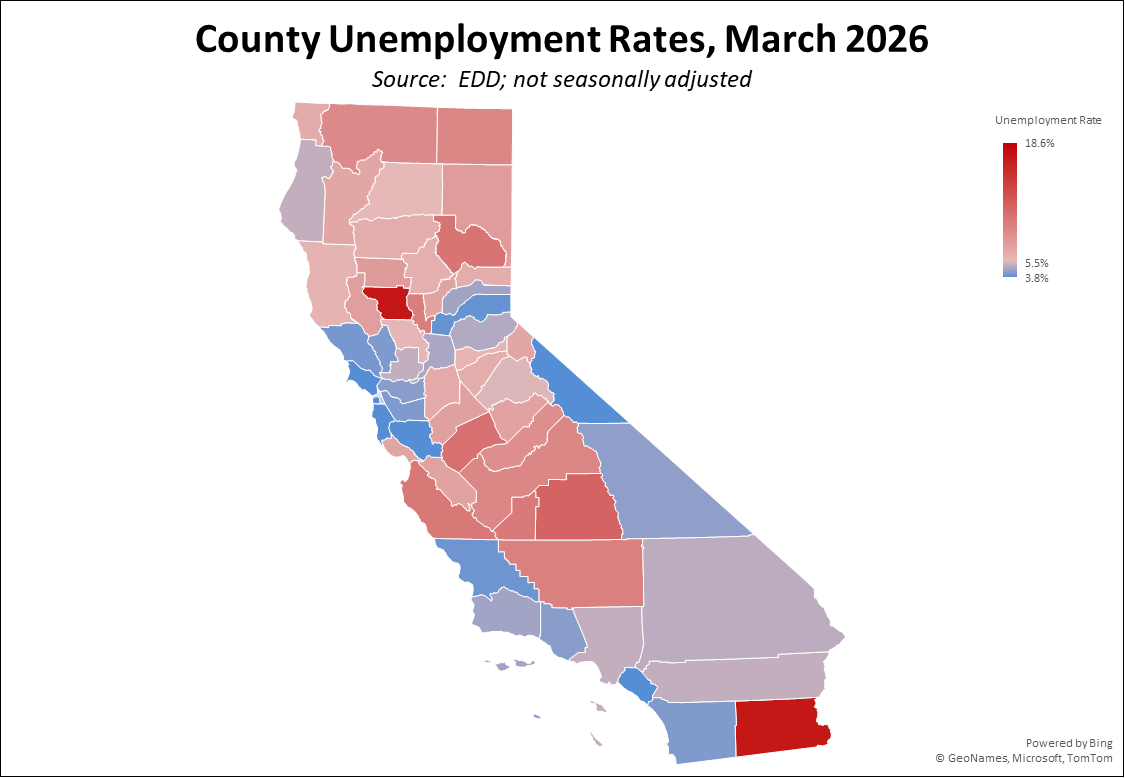
Counties with Double-Digit Unemployment
The number of counties with an unemployment rate (not seasonally adjusted) at 10% dropped to 6. The unadjusted rates ranged from 3.5% in San Mateo to 17.0% in Colusa.
In the chart, counties with rates higher than the state average are coded in red.